












 About Us
 Brand
Brand
 Career
 Contact Us



 +91-7314623098






In today’s fast-evolving VUCA (Volatility, Uncertainty, Complexity, and Ambiguity) world, data-driven decision-making is pivotal for organizational success.

HR departments are no longer just administrative units; they are strategic partners in driving business growth. However, while the importance of HR analytics in strategic decision-making grows, only 22% of HR professionals believe their organizations are effectively utilizing these tools.
This shows a significant gap in adopting and leveraging HR analytics effectively within organizations. By harnessing data and analytics, HR professionals not only glean critical insights into workforce trends but also pinpoint improvement opportunities that are closely aligned with broader organizational objectives.
In this blog, we have listed 10 key focus areas and corresponding metrics that are a must for any HR function to track:
What Are HR Metrics?
HR metrics are quantifiable measurements that help you assess the effectiveness of your organization’s human resources functions. By tracking these metrics, you can identify trends and areas for improvement in your HR strategies.
For example, the “Turnover Rate” metric measures the percentage of employees who leave your company over a specific period. It helps you understand employee retention and satisfaction.
Your organization’s HR metrics allow you to:
- Assess the effectiveness of HR initiatives
- Identify trends in employee behaviour and performance
- Make informed decisions about HR processes
- Demonstrate the ROI of different HR programs to leadership
- Predict future workforce needs
Why HR Metrics are Important?
HR metrics are crucial because they transform abstract HR activities into measurable outcomes, providing a clear lens through which the impact on your organization’s goals can be observed and quantified. Here are the top five reasons why HR metrics are vital:
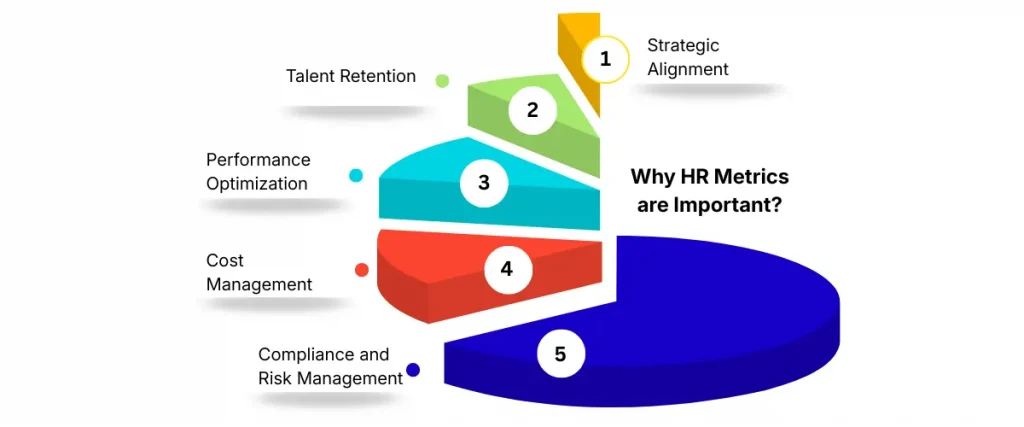
- Strategic Alignment: HR metrics enable you to align HR initiatives with business objectives, ensuring that every HR activity supports overarching goals, thus maximizing return on investment in human capital.
- Talent Retention: By tracking metrics such as turnover rates and employee satisfaction, you can gain insights into what keeps employees engaged and committed, allowing you to implement targeted retention strategies that reduce costly turnover.
- Performance Optimization: Metrics related to employee performance and productivity can help identify high performers and pinpoint areas where training is needed, enabling you to optimize workforce output in alignment with your organization’s demands.
- Cost Management: Through metrics like cost-per-hire and benefits utilization, you can more effectively manage and optimize your budget, ensuring financial resources are used efficiently within your HR processes.
- Compliance and Risk Management: Regular monitoring of compliance-related metrics ensures your organization adheres to legal standards and employment laws, minimizing the risk of costly penalties and enhancing governance.
38 Essential HR metrics to track in 2026
1. HR Tools and Services metrics
- Per Employee Cost: This metric measures the total investment in HR services, technology platforms, and HR operations divided by the number of employees in the organisation. It helps leaders understand how HR resources are being utilised and provides visibility into the overall cost of delivering HR services across the workforce.
- HR Software Employee Adoption Rate: HR software adoption rate measures how actively employees engage with HR systems and self-service platforms. High adoption rates often indicate that employees find the platform accessible and useful, while lower adoption may highlight opportunities to improve user experience, training, or system accessibility.
- HR-to-Employee Ratio: The HR-to-employee ratio compares the number of HR professionals to the total workforce. This metric helps organisations assess whether HR teams have the capacity to support workforce requirements effectively. It can also highlight opportunities to improve efficiency through process optimisation and automation.
- ROI of HR Software: Return on investment (ROI) measures the value generated from HR technology investments compared with implementation and operating costs. Organisations often evaluate efficiency improvements, reduced administrative effort, process automation, and enhanced employee experiences when assessing the impact of HR software.
2. Recruitment Metrics
- Time to Fill: The average number of days it takes to fill an open position. This tells you about the efficiency of your recruitment process and the health of your talent pipeline.
- Cost per Hire: The average amount spent to hire a new employee. This defines the financial efficiency of your recruitment efforts.
- Quality of Hire: A composite score reflecting the overall value a new hire brings to the organization. This helps identify the effectiveness of your hiring process in selecting high-performing candidates.
- Source of Hire: The channels through which successful candidates are recruited. This identifies which all recruitment channels are most effective for your organization.
- Acceptance Rate: Offer acceptance rate measures the percentage of candidates who accept employment offers compared to the total number of offers extended. This metric helps organisations evaluate the competitiveness of their employer brand, recruitment process, compensation strategy, and overall candidate experience.

Suggested Read:
Recruitment Process Guide For HRs to Hire Top Talent
3. Onboarding Metrics
- New Hire Turnover Rate: The percentage of new employees who leave within their first year. This tells you the effectiveness of your onboarding process and initial employee experience.
- Time to Productivity: The average time it takes for a new hire to reach full productivity. This helps evaluate the efficiency of your onboarding and training programs.
- Onboarding Satisfaction Rate: The percentage of new hires satisfied with the onboarding process. It helps you capture the quality and effectiveness of your onboarding program from the employee’s perspective.
- .Demographics Metrics: Demographic metrics help organisations understand the composition of new hires across factors such as experience levels, gender representation, educational backgrounds, and other workforce characteristics. These insights can support diversity initiatives and help organisations evaluate the effectiveness of their talent acquisition and onboarding strategies.
4. Employee Engagement Metrics
- Employee Engagement Score: A measure of how committed and motivated employees are in their roles. This identifies the overall level of employee satisfaction and dedication to the organization.
- Absenteeism Rate: The percentage of workdays lost due to employee absences. This helps identify potential issues with employee health, motivation, or work-life balance.
- Overtime Hours: The ratio of overtime hours to regular hours worked. This helps you relook your workload distribution and potential for employee burnout.
- Time Since Last Promotion: This metric tracks the average time employees spend in their current role before receiving a promotion or career advancement opportunity. Monitoring career progression trends helps organisations identify potential development gaps and better understand factors that may influence employee engagement, retention, and long-term career growth.
5. Exit Metrics
- Employee Turnover Rate: The percentage of employees who leave the organization over a given period. This helps understand the overall stability of your workforce.
- Voluntary Turnover Rate: Voluntary turnover rate measures the percentage of employees who willingly resign from their jobs over a given period. It is calculated by dividing the number of voluntary leavers by the average number of employees, multiplied by 100. The rate typically averages 13% but varies significantly by industry.
- Retention Rate: The percentage of employees who remain with the organization over a given period. This focuses on your ability to retain talent and maintain organizational knowledge.
- Retention Rate for High Performers: This metric measures an organisation’s ability to retain employees who consistently demonstrate strong performance and contribute significantly to business outcomes. Monitoring retention among high-performing employees helps organisations evaluate talent management strategies, identify potential retention risks, and strengthen workforce stability.
Suggested Read:
Complete Guide to Employee Retention in a Volatile Labor Market
6. Learning and Development Metrics
- Training ROI: The financial return on investment for training programs. This helps you drive the effectiveness and value of your training initiatives.
- Training Participation Rate: The percentage of employees who complete offered training programs. This helps in identifying Employee engagement with learning opportunities and the perceived value of your training programs.
- Training Completion Rate: Training completion rate measures the percentage of employees who successfully complete assigned learning programmes. This metric helps organisations evaluate participation levels, identify barriers to learning, and assess the effectiveness of training delivery methods across the workforce.
- Training Effectiveness: Training effectiveness evaluates whether learning initiatives contribute to improved employee performance, productivity, knowledge retention, or skill development. Organisations may assess this through feedback, performance outcomes, assessments, or business results linked to training programmes.
- Training Expenses per Employee: This metric measures the average investment made in employee learning and development activities. Tracking training expenditure helps organisations manage learning budgets effectively while assessing the value delivered through workforce development programmes.
- Skills Gap Closure Rate Definition: The percentage of identified skill gaps that are successfully addressed. This helps to evaluate the effectiveness of your learning and development initiatives in meeting organizational needs.
7. Diversity and Inclusion Metrics
- Workforce Diversity Ratio: The proportion of employees from different demographic groups. It tells about the level of diversity within your organization.
- Pay Equity Ratio: The comparison of average pay between different demographic groups. It helps evaluate whether there are pay disparities that need to be addressed.
8. Employee Advocacy Metrics
- Employee Net Promoter Score (eNPS): A measure of how likely employees are to recommend their workplace to others.
9. Performance Management Metrics
- Goal Completion Rate: The percentage of set goals that are achieved by employees. It helps identify the effectiveness of goal-setting processes and employee performance.
- Employee Performance Score: Employee performance scores provide insights into workforce performance based on established evaluation criteria. Analysing performance data across teams and departments helps organisations identify strengths, development opportunities, and trends that may influence workforce planning decisions.
- Performance Review Completion Rate: The percentage of scheduled performance reviews that are completed. It tells about the consistency and commitment to performance management processes.
- Performance and Potential Matrix: Often referred to as a talent matrix, this framework helps organisations evaluate employees based on both current performance and future potential. It supports talent reviews, succession planning, leadership development, and workforce planning initiatives.
- Revenue per Employee: Revenue per employee measures the amount of revenue generated relative to workforce size. It provides organisations with a high-level view of workforce productivity and operational efficiency while supporting broader business performance analysis.
- High Performer Retention Rate: The percentage of top-performing employees retained over a given period. It helps identifying your ability to keep your best talent.
10. HR Efficiency Metrics
- HR-to-Employee Ratio: The number of HR staff relative to the total number of employees. This tells the efficiency and scalability of your HR function.
- Cost of HR per Employee: This metric measures the cost of delivering HR services relative to the size of the workforce. It helps organisations understand HR operational efficiency and assess how effectively resources are being allocated to support employees and business objectives.
11. Compensation and Benefits Metrics
- Compa-Ratio: The ratio of an employee’s actual salary to the midpoint of the salary range for their position. This tells how your compensation aligns with market rates and internal equity.
- Benefits Utilization Rate: Benefits utilisation rate measures the percentage of employees who actively use available benefits programmes. Understanding utilisation patterns helps organisations evaluate the relevance and effectiveness of benefits offerings while supporting future benefits planning and investment decisions.
How to Collect and analyze the metrics data
Collecting and analyzing HR metrics effectively involves a systematic approach to gathering accurate data and extracting meaningful insights. Here’s how you can efficiently manage this process:
1. Define Relevant Metrics
Start by identifying the metrics that align closely with your organizational goals. These could include performance indicators like employee turnover rate, time to fill positions, employee engagement levels, and more.
2. Use the Right Tools
Implement HR management systems and data analytics tools that can automate data collection and reporting. Tools like HRIS (Human Resource Information System), ATS (Applicant Tracking System), and employee feedback platforms can provide comprehensive data with less effort.
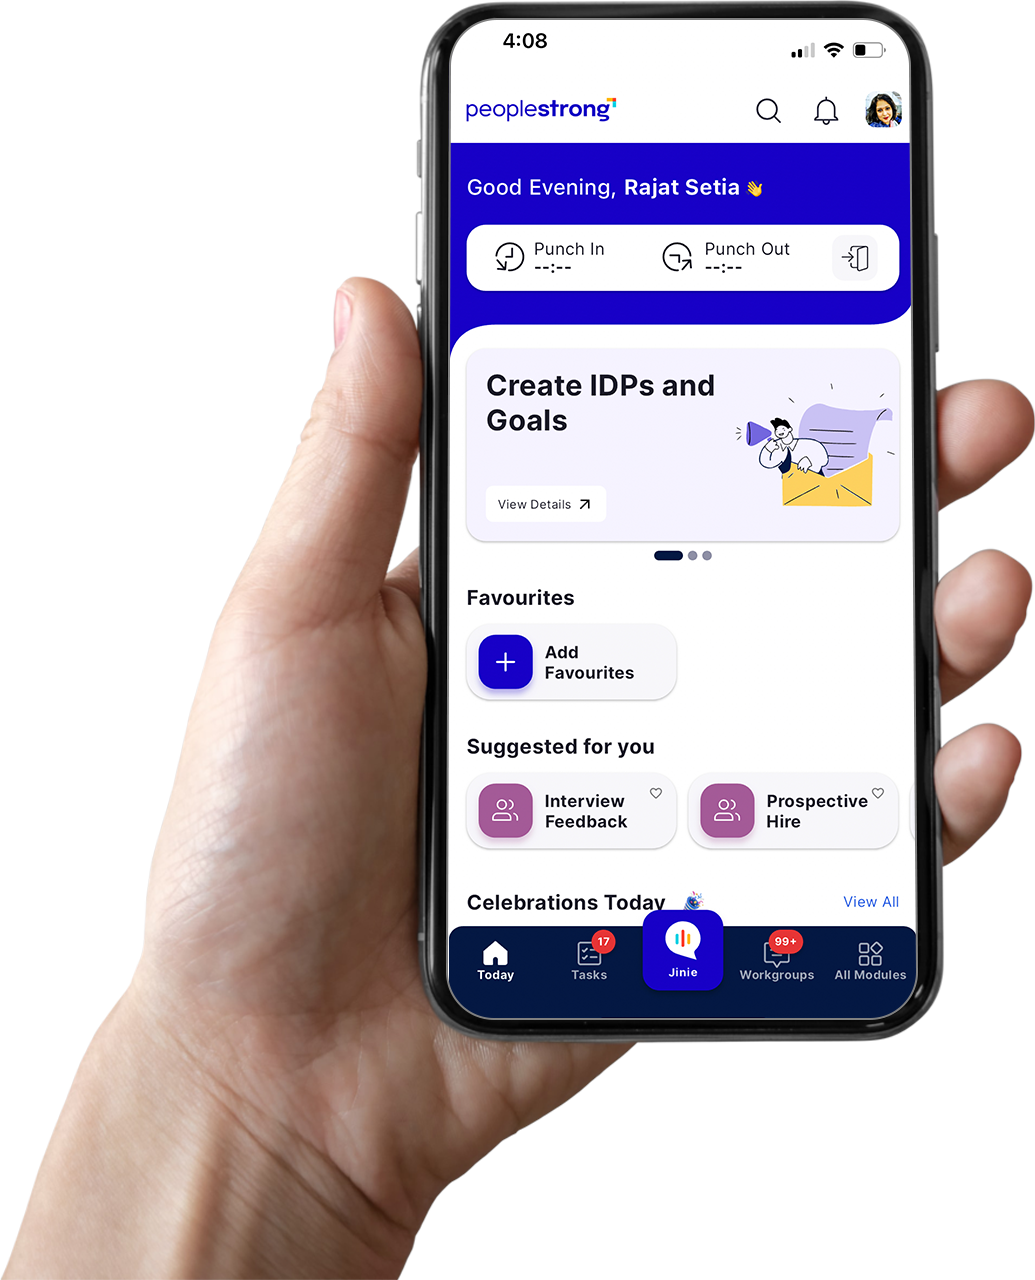
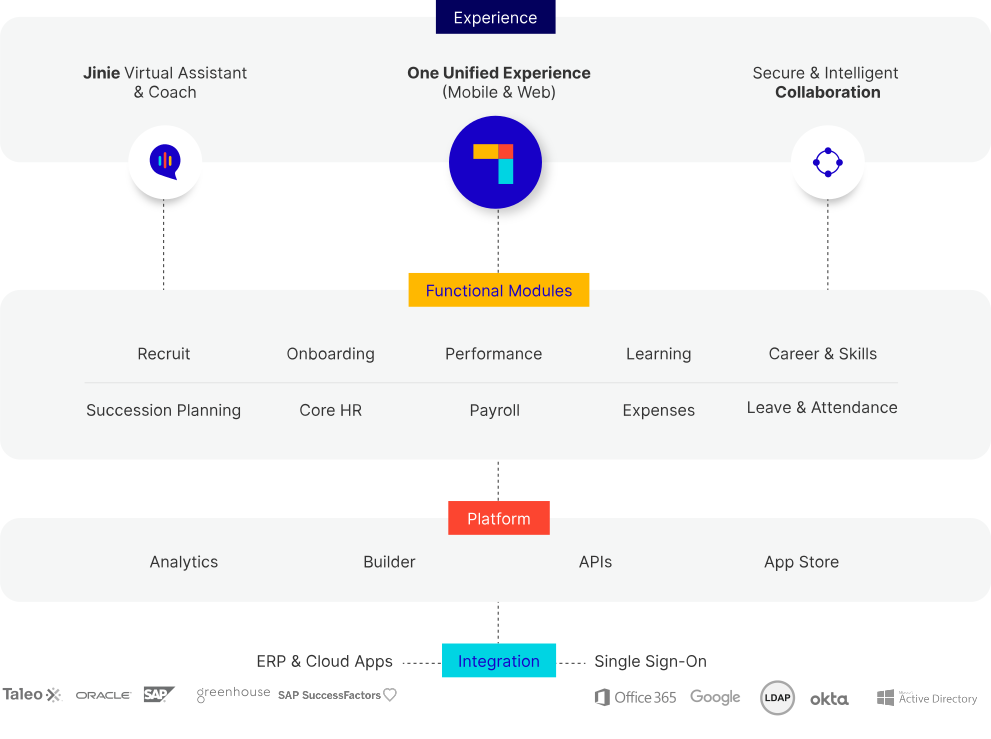
You can also incorporate PeopleStrong’s comprehensive HR Analytics Software. It excels in streamlining HR metric collection and analysis through its advanced analytics capabilities. With features like AI-powered insights, customizable dashboards, and predictive analytics, PeopleStrong transforms complex data sets into actionable insights.
This enables HR professionals to track performance trends effectively, optimize workforce planning, and enhance decision-making processes. The platform also provides tools for real-time data visualization to simplify the management of critical HR metrics and reduce reliance on manual spreadsheet tasks.
3. Collect Data Regularly
Establish a routine for collecting data to ensure consistency and accuracy. Depending on the metric, this could be monthly, quarterly, or annually. Automated tools can help maintain this schedule without manual intervention.
4. Analyze Your Collected Data
Analyze the collected data to identify trends, correlations, and anomalies. Use statistical methods and data visualization tools to make the data understandable and actionable. For example, trend lines in turnover rates can indicate the effectiveness of new HR policies.
5. Act on the Data
The final step is using the insights gained to inform HR strategies and interventions. This could involve adjusting recruitment strategies, redesigning training programs, or revising employee benefits based on the findings.
How to Present HR Metrics to Leadership
Executives do not want to see endless columns of raw data. To catch their attention, you must translate your HR numbers into clear business impacts.
- Focus on the Big Picture: HR metrics are most effective when connected to broader business objectives. Rather than presenting individual workforce numbers in isolation, organisations should demonstrate how people-related trends influence business performance, productivity, employee retention, and workforce planning..
- Keep Visuals Simple: Clear dashboards, concise reports, and well-structured visualisations help leadership teams interpret information more efficiently. Presenting data in a simple and accessible format allows stakeholders to focus on insights rather than navigating complex reports.
- Lead with the Solution: Metrics are most valuable when accompanied by recommendations and next steps. Alongside highlighting trends or challenges, HR teams should provide practical actions that support decision-making and help address identified opportunities.
As We Conclude
In an era where data drives business decisions, HR departments must embrace analytics to demonstrate their strategic value and contribute to organizational success.
However, it’s important to remember that metrics are tools, not solutions. The true value lies in how organizations interpret and act upon the insights gained from these metrics. HR leaders must cultivate a data-driven culture within their teams and develop the skills necessary to translate numbers into actionable strategies.
As the business landscape continues to evolve, so too will the metrics that matter most. By leveraging these key HR metrics and embracing a data-driven approach, HR departments can position themselves as strategic partners in driving organizational performance, fostering a positive work culture, and ultimately contributing to the company’s long-term success.

Frequently Asked Questions
What is the difference between HR metrics and HR KPIs?
HR metrics measure various aspects of workforce performance and HR operations, such as employee headcount or training participation. HR KPIs (Key Performance Indicators) are a subset of metrics that are directly linked to strategic business objectives and used to evaluate organisational performance against specific goals.
How do I start tracking HR metrics?
Begin by identifying workforce metrics that align with your organisation’s priorities and business objectives. Establish reliable data sources, define measurement methods, and create a consistent reporting process. Modern HR technology platforms can help automate data collection and improve reporting accuracy.
What tools help track HR metrics?
HR technology platforms, workforce analytics tools, HRMS solutions, and reporting dashboards are commonly used to track HR metrics. These tools help organisations collect workforce data, monitor trends, and generate actionable insights that support strategic decision-making.
What are the most critical HR metrics?
The most relevant HR metrics vary by organisation and business objectives. Commonly monitored metrics include employee turnover, time-to-hire, cost-per-hire, employee engagement, workforce productivity, learning participation, and retention rates, as these often provide valuable insights into organisational performance.
What metrics predict workforce trends?
Metrics such as employee engagement, absenteeism, turnover patterns, internal mobility, skills development, and workforce demographics can help organisations identify emerging workforce trends. Analysing these indicators supports proactive workforce planning and informed decision-making.
How frequently should HR metrics be measured?
The frequency depends on the metric and business requirements. Operational metrics may be reviewed monthly, while broader workforce indicators such as engagement, retention, and organisational effectiveness are often analysed quarterly or annually to identify meaningful trends over time.
Can HR metrics help address staffing problems?
Yes. HR metrics provide valuable insights into recruitment performance, workforce capacity, employee turnover, and hiring effectiveness. These insights help organisations identify challenges, evaluate workforce needs, and implement targeted actions to improve staffing outcomes.
Are HR Metrics and HR Analytics the Same?
No. HR metrics focus on measuring and reporting workforce data, while HR analytics goes a step further by analysing relationships, trends, and patterns within that data. HR analytics helps organisations understand workforce outcomes and supports more informed predictions and decision-making.