













 About Us
 Brand
Brand
 Career
 Contact Us



 +91-7314623098



Friction in leadership meetings is often predictable: differing numbers, competing interpretations, and delayed decisions as data is being reconciled. The scale of this problem is larger than most leadership teams assume: McKinsey’s research on managerial decision-making found that respondents typically spend more than 30% of their time on decisions, and rate over half of that time as used ineffectively, a gap McKinsey estimates costs a typical Fortune 500 company roughly $250 million a year in wasted management time. This friction is eliminated with Management Information System (MIS) reporting, which provides one verified baseline of performance data directly from enterprise systems.
Well-executed MIS reporting speeds up decision-making, ensures operational accountability, and highlights emerging risks in an actionable manner. Poorly structured reporting creates administrative overhead and dozens of unread, low-value documents.
Key Takeaways
- MIS reports convert raw data into a single source of truth, eliminating conflicting functional metrics during executive reviews.
- MIS reporting is a continuous operational cycle: inputs, validation, structuring, analysis, presentation, and mandatory action follow-up.
- Reports serve distinct organisational levels, ranging from operational daily logs for plant supervisors to high-level monthly summaries for board members.
- A metric earns its place on an MIS dashboard only when evaluated against a benchmark (targets, budgets, or historical performance) and paired with variance commentary.
- Unused reports should be retired periodically to prevent reporting bloat and ensure management focus remains on actionable metrics.
What is an MIS report? Meaning and definition
An MIS is a combination of people, processes, data, and technology that an organisation uses to provide itself with the information it needs to operate and make decisions. This system generates an MIS report: a structured document that integrates data from one or more functions and presents it in a form appropriate for a particular management review or decision.
The core purpose of an MIS report is to convert raw data into actionable information. A raw export of 4,000 transactions is data; identifying that “the Western region missed its collection target for the third consecutive month” is information.
Some features make a good MIS report:
Defined Timeframe: Covers a specific, set period of time (daily, weekly, or monthly).
Structural Consistency: Maintains a standardised format so results remain comparable across periods.
Benchmarked Performance: Links actual performance to a baseline, a target, a budget, or prior-period results.
Predictable Cadence: Produced on a regular schedule rather than generated on an ad-hoc basis.
Targeted Distribution: Delivered directly to stakeholders who possess the authority to act on the insights.
Why do Businesses need MIS Reports?
A business of any size generates more operational data than its leadership can absorb. Invoices, attendance logs, order books, pipeline records, bank statements, production registers. The volume grows with the company. MIS reports exist to compress that volume into a view a decision-maker can use.
The specific needs they serve:
Unified Source of Truth: When sales reports one revenue figure and finance reports another, every review becomes an audit. A defined MIS, with defined data sources and definitions, removes that friction.
Structured Review Cadence: A monthly review cycle forces every function to face its numbers at a fixed interval. Without it, underperformance tends to surface late, usually at quarter end when recovery is expensive.
Ownership Through Operational Visibility: People manage what is measured. A report which mentions a particular region, a product line, or a department automatically creates an owner of the next discussion.
Proactive Risk Mitigation: It relies on leading metrics, as data usually flags problems long before they show up in final results. Early signals, like rising past-due accounts, pipeline depletion, or factory absenteeism, give organisations time to resolve operational friction before it impacts the bottom line.
Scalable Executive Oversight: A director cannot sit with every team. MIS reporting is how oversight extends across locations, functions, and business lines without adding layers of supervision.
Institutional Memory & Strategic Valuation: Organisations that maintain disciplined reporting build a historical record. When planning the next year or making a case to a lender or investor, three years of consistent monthly MIS data is worth more than any amount of recollection.
How do MIS reports work?
An MIS report is a cycle and not just an output.
Inputs: All data that reflects what is happening in the company – ERP, accounting, CRM, HRMS and attendance, POS, production reports, bank statements and certainly some data from a spreadsheet maintained outside all other systems by a department.
Collection and validation: The reporting team collects data for the defined period and validates it for completeness and cut-off accuracy. This is where most reporting mistakes happen. When the sales team books an order on the 31st day, and finance does it on the 2nd, both are right. Resolving that discrepancy is part of the process.
Structuring: The validated data is structured to fit the set reporting template. Consistency is more important here than elegance. If this month’s report uses a different definition of “active customer” than the previous month’s report, the trend does not make any sense at all.
Data analysis: The structured data is compared against the budget, variances are computed, and trends and responsible segments are determined.
Presentation and distribution: The tables, charts and commentary are compiled and distributed to the intended recipients before the review meeting.
Action and follow-up: This is the step weak reporting systems skip. Decisions from the review are recorded with owners and deadlines, and MIS tracking of those actions becomes part of the next cycle’s report. A report that is never followed up gradually loses the attention of the people it was built for.
Types of MIS Reports
The categories below are practical rather than academic. Most companies blend them, and a single monthly pack often contains elements of several types.
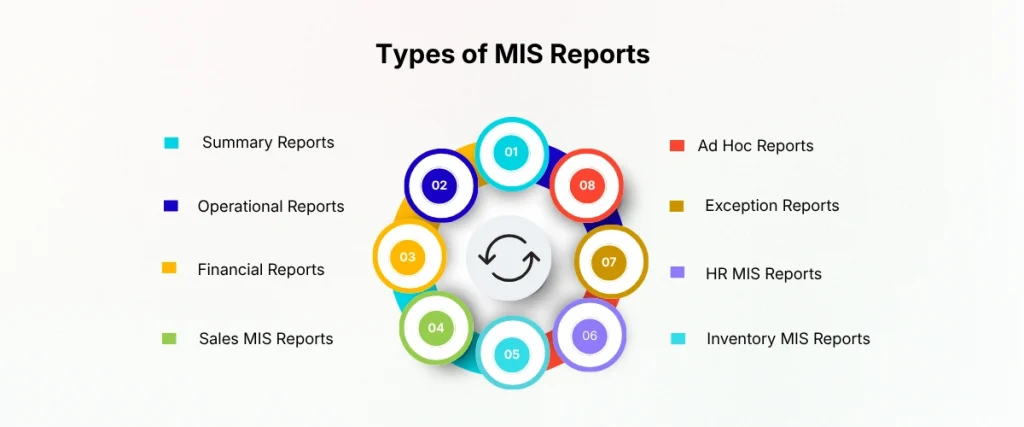
Summary Reports
A summary report condenses a period’s performance into a compact, high-level view. It does not attempt to show everything. It answers the question: how did the business perform, and where should attention go next?
Senior leaders generally should not be reading transaction-level detail. The summary report is what sits in front of them, with the option to drill down when a number demands explanation.
Key Insights: Performance against plan, the largest movements since the previous period, and the two or three areas that need management attention.
Best For: Leadership review meetings, board updates, and business heads who need a cross-functional picture rather than functional depth.
Frequency: Monthly, with quarterly consolidations for boards and investors.
Operational Reports
Operational reports sit at the opposite end of the scale. They carry transaction-level and shift-level detail: orders dispatched and pending, machine downtime, ticket status, deliveries failed, tasks completed against plan. Their audience is supervisors and functional managers who need to correct course within the day or week, not at month end.
One common failure with operational reports is scope creep upward. When daily dispatch registers start landing in the CEO’s inbox, attention gets fragmented and the reporting loses its purpose at both levels.
Key Insights: Where execution is deviating from plan right now: pending items, delays, failures, and backlogs by team, shift, or location.
Best For: Operations managers, plant supervisors, customer service leads, and logistics teams.
Frequency: Daily or weekly, sometimes shift-wise in production and distribution environments.
Financial Reports
Financial MIS reports present the company’s monetary position and performance: profit and loss snapshot, cash position, budget variance, receivables and payables ageing, working capital, and cost breakdowns by department or cost centre. Cash deserves particular emphasis. A profitable month with a weak collections report is still a problem, and receivables ageing is often the report that reveals it.
Key Insights: Profitability against budget, cash generation and burn, outstanding receivables beyond terms, and cost lines moving outside expectations.
Best For: CFOs and finance teams, audit and board committees, promoters, and lenders.
Frequency: Monthly, aligned to the close of books, with quarterly and annual consolidations.
Sales MIS Reports
Sales reports track target versus achievement across representatives, regions, products, and channels, along with pipeline coverage, conversion rates, average deal size, and collection status. Monthly is often too slow for sales. A weekly cadence gives managers a realistic window to intervene while the quarter can still be saved, which is why many organisations run a weekly sales MIS alongside the monthly one.
Key Insights: Gap to target by rep and region, pipeline strength against future targets, deals slipping or stalled, and collection performance against invoicing.
Best For: Sales leadership, regional managers, and individual representatives reviewing their own numbers.
Frequency: Weekly for distributed teams, monthly for leadership and board-level review, daily in high-velocity businesses like FMCG distribution.
Inventory MIS Reports
Inventory reports track stock positions against reorder levels, consumption and turnover rates, ageing of stock, and slow-moving or dead inventory by SKU and location. Carrying cost is the quiet expense these reports expose. Stock that sits unsold ties up working capital, occupies space, and often ends up written down. The report that surfaces dead stock early pays for itself.
Key Insights: Items below reorder level, items with excess or ageing stock, turnover ratios by category, and the value locked in slow-moving inventory.
Best For: Purchase and supply chain heads, warehouse managers, and plant leadership.
Frequency: Daily or weekly for fast-moving items, monthly for value and ageing analysis.
HR MIS Reports
HR reports cover headcount and movement, attrition by department and band, hiring funnel performance, attendance patterns, payroll cost as a percentage of revenue, and training or productivity measures. Attrition deserves trend treatment rather than single-month readings. A spike in one month may be coincidence; three months of rising exits in one department is a management issue with a cause worth finding, and the cost of leaving it unaddressed is not trivial: SHRM estimates that replacing a single employee typically costs between 50% and 200% of their annual salary once recruiting, onboarding, and lost productivity are accounted for, a range referenced in SHRM’s research on employee replacement costs.
Key Insights: Headcount against plan, attrition trends and reasons, cost per hire, payroll cost movement, and capacity gaps ahead.
Best For: CHROs and HR teams, business heads planning capacity, and finance for manpower cost review.
Frequency: Monthly, with headcount and attrition often also reviewed quarterly.
Exception Reports
Exception reports show only what deviates from defined norms: stockouts, invoices overdue beyond 30 days, deliveries failed, downtime beyond threshold, unusual expense entries, a sudden jump in absenteeism. Their value is attention management. A leader who receives 40 metrics learns to skim. A leader who receives 6 deviations reads all 6. The design work lies in setting thresholds. Set them too tight and the report becomes noise. Set them too loose and problems arrive after the damage. Thresholds need periodic review, and the number of exceptions triggered is itself a useful signal about whether they are calibrated correctly.
Key Insights: Only deviations: what broke the norm, by how much, and where.
Best For: Anyone accountable for acting on deviations quickly, from plant managers to credit controllers.
Frequency: Real-time or daily, depending on the process.
Ad Hoc Reports
Ad hoc reports answer questions the recurring reports were not designed for. Why did one product’s margin drop in two states? What does the customer complaint pattern of the last quarter suggest? What would a 10% capacity addition do to unit cost? They are valuable precisely because they are unconstrained by the monthly template. The risk is organisational: ad hoc requests have a way of becoming permanent unpaid work. Teams that handle them well keep a log of requests and periodically decide which ones deserve promotion into the standing reports.
Key Insights: Answers to specific, non-recurring questions, often combining data from multiple functions.
Best For: Investigations, planning exercises, due diligence, and one-off management questions.
Frequency: As required.
Key Components of an MIS Report
Whatever the type, a report that supports decisions tends to contain the same structural elements:
- Defined Period and Scope: The report states exactly what window it covers and what it excludes. Ambiguity here quietly invalidates every comparison drawn from it.
- Contextual Metrics & Benchmarks: Numbers appear alongside a target, a budget, or the previous period. A figure in isolation is very hard to act on.
- Variance Analysis & Root-Cause Commentary: The gap matters, but so does the reason. Reports that state variance without commentary push the entire analytical burden onto the reader.
- Visual Exception Flagging: Problem areas are flagged visually so a reader scanning for five minutes still lands on them.
- Data Provenance & Governance: Where the numbers came from, and who prepared the report. This becomes essential the moment two departments disagree.
- Forward-Looking Actionable Insights: What the numbers mean and what is proposed about them. This is the difference between a data export and a management report.
- Standardised Structural Consistency: The same structure every period, so readers learn where to look and trends remain comparable.
MIS Report Format and Template: What Should It Include?
A standard MIS report template makes reports comparable across periods and reduces the effort of preparation, since the structure never has to be rebuilt from scratch. The sections below make up a complete format, though not every report needs all of them. An operational daily report may need only the header, tables, and exceptions. A monthly leadership pack needs everything.
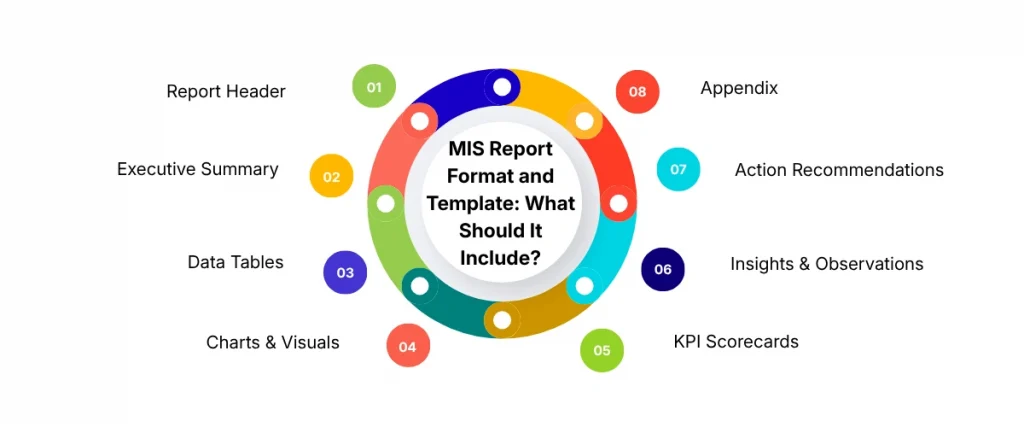
Report Header
The header carries the report title, period covered, date of preparation, name of the owner, and distribution list. It sounds trivial until version confusion sets in. When two people arrive at a meeting with different figures, the first question should be answerable from the header alone: are we looking at the same version of the same period? A confidentiality marking is worth adding where the pack contains payroll, margin, or strategy data.
Executive Summary
Three to six lines covering the period’s result, the main movements, and the decisions the report is asking for. Written last, placed first. The summary is the part senior readers actually use. If the rest of the pack disappeared, a good executive summary would still carry the meeting.
Data Tables
Tables carry the substance. A few conventions keep them readable: one message per table, units clearly stated, totals shown, consistent rounding, and no more precision than the data supports. Showing attrition as 3.42% implies an accuracy the underlying count of exits cannot justify.
Charts & Visuals
Charts answer questions faster than tables, provided the chart type matches the question. Trends belong on line charts. Comparisons across categories belong on bar charts. Composition belongs on stacked bars, with caution around pie charts once there are more than three or four slices. Direct labelling beats legends. If the reader has to look back and forth between the chart and a legend to decode it, the chart is doing the reader’s work rather than its own.
KPI Scorecards
A scorecard presents each key indicator with its target, actual, previous period, and a status mark, typically green, amber, or red. The colour coding lets a reader locate problems in seconds. Status thresholds should be agreed and stable. If amber means 90 to 95% of target this month and 85 to 92% next month, the colours stop meaning anything.
Insights & Observations
This section converts figures into interpretation: what moved, the likely drivers, and what remains uncertain. Hypotheses should be labelled as hypotheses. “Collections dipped due to two large overdue accounts in the north” is a checkable claim. Writing it as settled fact when it is a guess damages the report’s credibility when someone checks.
Action Recommendations
Specific proposals with an owner and a date. “Improve collections” is not an action. “Credit control to escalate the two overdue accounts above ₹15 lakh to legal by the 20th” is. A useful discipline is separating recommendations from decisions. The report proposes. The review meeting decides. The decided actions then flow into MIS tracking for the next cycle.
Appendix
Definitions, calculation formulas, data source list, and any known gaps. This section is what allows the report to survive scrutiny. When a new CFO or auditor questions how “net revenue” is calculated, the answer should already be documented rather than reconstructed from memory.
MIS Report Examples
Monthly MIS Report
The monthly MIS is the backbone of management reporting in most mid-size companies. It is a cross-functional pack, typically two to six pages, covering sales, finance, operations, inventory, and HR, circulated a few days before the monthly review.
The monthly MIS report format usually follows the order of the business: revenue first, then margin and cost, then operational drivers, then people. A typical sample extract looks like this:
| Metric | Target | Actual | Previous Month | Status | Comment |
| Revenue (₹ lakh) | 500 | 471 | 455 | Amber | Two institutional orders slipped to next month |
| Gross margin (%) | 34 | 32.6 | 33.8 | Amber | Input cost up in packaging |
| Collections (₹ lakh) | 480 | 402 | 470 | Red | Two accounts above 45 days |
| Order book (₹ lakh) | 1,200 | 1,350 | 1,180 | Green | Two large orders closed |
| Inventory value (₹ lakh) | 300 | 355 | 320 | Amber | Slow movement in spares |
| Attrition (%) | 2.0 | 2.4 | 1.8 | Amber | Concentrated in one department |
| Headcount | 420 | 412 | 418 | Green | Hiring underway for 9 roles |
The value of such a sample lies in what it forces: every red and amber needs a comment, and every comment needs a follow-up. Numbers alone would leave the meeting to interpretation.
Payroll MIS Report
Prepared after each payroll cycle, this report reconciles manpower cost and confirms the payroll ran clean. A payroll MIS report typically contains:
- Headcount processed, with additions, exits, and transfers during the month
- Gross salary, allowances, deductions, statutory contributions (PF, ESI, professional tax, TDS), and net payout
- Overtime and incentive amounts, separately identified
- Department-wise and location-wise cost split
- Variance against the previous month, with reasons for material movements
- Reconciliation with attendance data and with the finance ledger
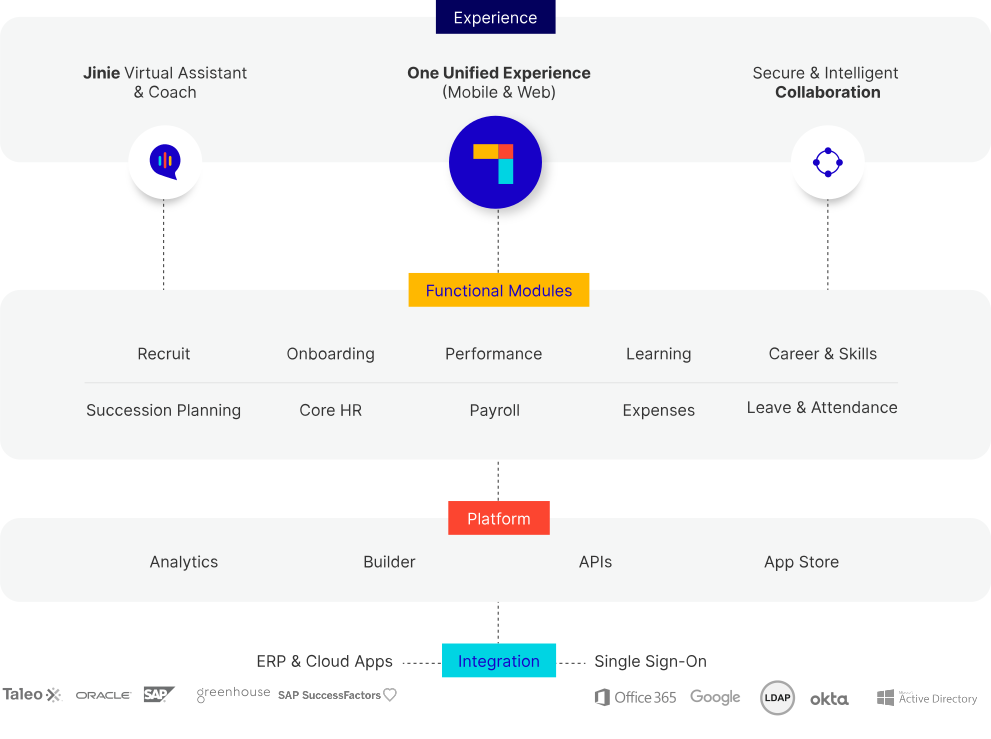
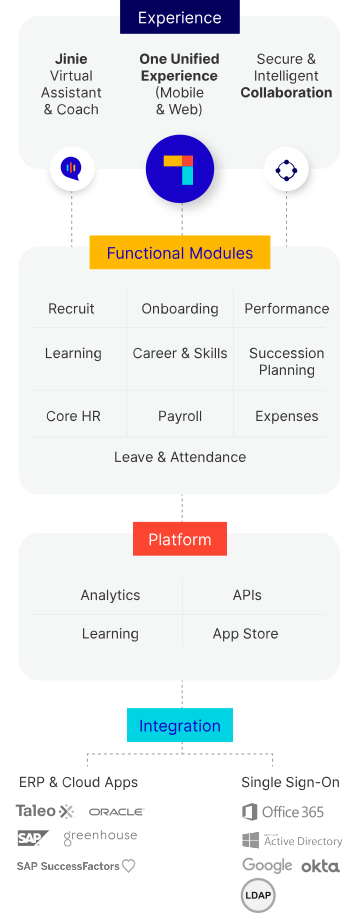
The last two lines matter more than they appear to. Payroll is the single largest expense line in most companies, and it is also where errors hide longest. A monthly reconciliation between the HRMS headcount, the attendance system, and the amount actually paid is the control that catches mismatches, incorrect recoveries, and payments to separated employees. This is precisely where an integrated HRMS platform such as PeopleStrong earns its keep: when attendance, payroll, and headcount data sit in one system rather than three, the reconciliation step stops being a manual chase and becomes a built-in check.
Attendance and Leave MIS Report
This report summarises workforce availability: attendance percentage by department, late arrivals, absenteeism, shift adherence where applicable, and leave utilisation. It feeds two consumers. Payroll uses it as an input for deductions and calculations, and management uses it as an early indicator.
The early-indicator use is underexploited. Absenteeism climbing in one department for three consecutive months usually points to something specific: a supervisor problem, an engagement issue, or burnout around a production push. The attendance MIS is often where this shows up first.
Leave balances belong in the same report, because accumulated leave is a financial liability. An organisation sitting on heavy accrued leave across the workforce carries a real obligation, and the trend belongs in front of management rather than buried in the HRMS.
How to Prepare an MIS Report: A Step-by-Step Process
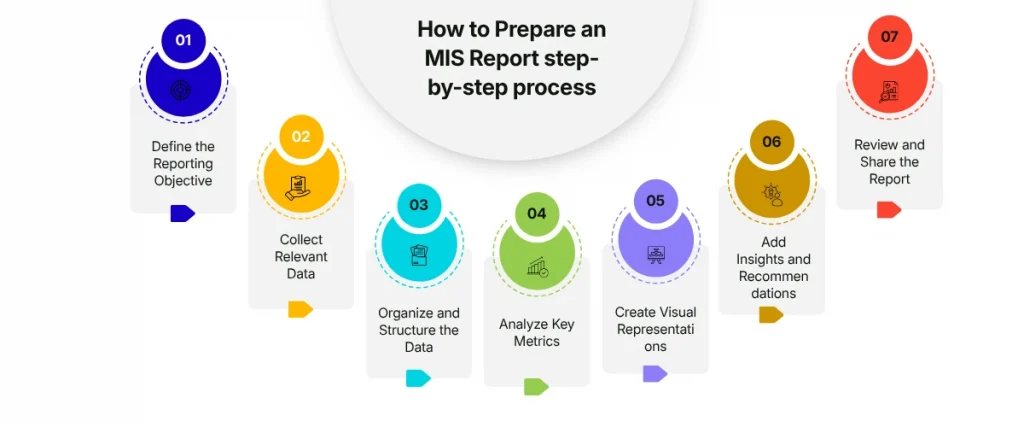
Define the Reporting Objective
Start with the reader and the decision, not the data. Who receives this report, and what will they do differently because of it? If the honest answer is nothing, the report does not need to exist. Most organisations that struggle with reporting have too many reports and too few decisions, and cutting is usually a better first move than adding.
Collect Relevant Data
Pull data from the source systems for the defined period. Confirm completeness: all locations reported, all invoices captured, cut-off dates consistent across sources. A missing branch or a mid-month data load quietly corrupts comparisons, and readers rarely catch it in the final report.
Organise and Structure the Data
Arrange the validated data into the fixed template. In practice this involves mapping, classification, and cleanup, since real-world data rarely arrives as cleanly as systems promise. Lock the definitions: what counts as revenue, what counts as an exit, which date applies to an order. Document them in the appendix so future preparers do not quietly redefine them.
Analyse Key Metrics
Compare against target and previous period. Calculate variances and examine trends over the last several periods rather than a single month. Segment the drivers: which region, product, or department moved the total. Ratios often reveal more than absolutes, payroll cost as a percentage of revenue being a good example.
Create Visual Representations
Translate the analysis into charts that match the questions readers will ask, following the conventions described in the format section. Resist the urge to visualise everything. Six clear charts serve a leadership reader better than twenty crowded ones.
Add Insights and Recommendations
Write the commentary: what moved, why, and what is proposed. Flag what remains unverified rather than presenting guesses as findings. Attach an owner and a date to each recommendation, and carry forward the status of actions from the previous period.
Review and Share the Report
Have someone other than the preparer check the numbers before circulation, particularly the totals and the prior-period comparisons that anchor the whole report. Version the document, distribute it before the review meeting so attendees arrive prepared, and archive it where the historical series is preserved. Reports that arrive during the meeting get skimmed. Reports that arrive after it get ignored.
MIS Report Use Cases
| Types of MIS Reports | Use Cases |
| Summary Reports | Monthly leadership reviews, board packs, investor updates |
| Operational Reports | Daily dispatch and production monitoring, service desk reviews, logistics tracking |
| Financial Reports | Budget variance review, cash and working capital management, lender and board reporting |
| Sales MIS Reports | Target tracking by rep and region, pipeline reviews, collection follow-up, incentive verification |
| Inventory MIS Reports | Reorder decisions, dead stock cleanup, working capital reduction, purchase planning |
| HR MIS Reports | Attrition analysis, manpower planning, payroll cost review, hiring pipeline tracking |
| Exception Reports | Credit control escalations, stockout alerts, downtime response, compliance monitoring |
| Ad Hoc Reports | Root cause investigations, pricing decisions, expansion planning, due diligence support |
Conclusion
An MIS report is a bridge between the data a business produces and the decisions its leaders must make. The bridge holds only when it is built deliberately: a fixed structure, honest comparisons, verified data, and commentary that says what the numbers mean.
The organisations that get the most from MIS reporting are usually the ones that treat the report portfolio as something to be managed. Reports are reviewed periodically. Ones nobody uses are retired. Measures that have drifted from the business are corrected. The alternative is the fate of most reporting systems, which is gradual accumulation until the monthly pack becomes a document people receive and no longer read. Poor data discipline carries a real cost long before it reaches this stage: Gartner estimates that poor data quality costs the average organisation $12.9 million a year in wasted effort, missed opportunities, and decisions made on the wrong numbers, and a fragmented MIS built on inconsistent sources is one of the more common ways that cost accumulates unnoticed.
The test of a good MIS report never changes. It is not the volume of data it contains. It is whether, after reading it, management knows what to do next.
FAQs of MIS Reports
What is the full form of MIS in reporting?
MIS stands for Management Information System. An MIS report is the structured output of that system, presenting data from across the business in a form that supports management review and decision-making.
What are the key components of an effective MIS report?
A defined period and scope, key metrics with targets and prior-period comparisons, variance analysis with explanation, exception highlighting, commentary and recommendations with owners, and documented data sources. A header identifying the version and preparer, plus an appendix of definitions, completes the structure.
Can MIS reports be automated?
Substantially, yes. Data extraction, transformation, and dashboard generation can all be automated through BI tools and system integrations, which removes most of the manual effort and the errors that come with it. Interpretation, context, and recommendations remain human work, and the definitions and thresholds still need periodic review regardless of how automated the pipeline is.
What are the benefits of MIS reporting?
A single version of operational truth, early visibility of problems, a predictable review rhythm, clearer accountability, faster meetings, and a historical data series that supports planning, lending, and investment discussions. The compounding benefit is cultural: organisations that review honestly every month find it harder for problems to hide.
What software tools can I use to create MIS reports?
Excel and Google Sheets remain the starting point for most companies and are entirely adequate for structured monthly reporting. Beyond that, BI platforms such as Power BI, Tableau, and Zoho Analytics handle automated dashboards and larger data volumes. ERP, HRMS, and CRM systems typically offer built-in or add-on reporting modules; for HR, payroll, and attendance MIS specifically, platforms such as PeopleStrong consolidate these data sources into a single system, which removes much of the reconciliation work described earlier in this guide. MIS tracking of follow-up actions is increasingly handled within collaboration tools so decisions and reports live in the same place.
What should I include in an MIS report for financial performance?
Revenue against budget, gross and net margin, expense lines against budget with variance commentary, cash position and movement, receivables ageing with specific overdue accounts, payables status, working capital position, and any statutory obligations due. Include the comparison columns that make the numbers interpretable: target, actual, previous period. The report should close with the specific financial risks flagged and the actions proposed against them.