











 About Us
 Brand
Brand
 Career
 Contact Us



 +91-7314623098



A senior leader gets asked a simple question about her own workforce and can’t answer it in the room. How many people left the night shift at the Pune plant last quarter? Headcount sits in one system, exits in an attendance file, replacement cost in payroll runs. By the time someone stitches them together in a spreadsheet, the decision has already been taken. The problem isn’t missing data. It’s that the data sits in systems never built to answer a question spanning all three, and closing that gap is what HR analytics in HRM, meaning analysis run inside the HR system itself, is meant to do.
This guide is written for CHROs, heads of HR operations and HRIS owners at enterprises of roughly 1,000 to 10,000+ employees who are deciding how much analytical capability their HR system itself needs to carry. Every example is drawn from Indian enterprises, where multi-state entities, mixed blue- and white-collar workforces and statutory payroll rules shape what the reporting has to handle.
TLDR
- HR analytics in HRM means turning hire-to-exit employee data into decisions inside the HR system of record, rather than exporting it into a separate dashboard tool.
- Capability sits on four levels: descriptive reporting, diagnostic analysis, predictive modelling and prescriptive action, each with its own metrics and enterprise use cases.
- Analytics works better inside the HRM because it reads the same records payroll, attendance and performance already run on, so numbers do not have to be reconciled before they can be discussed.
- The usual blockers are inconsistent master data, disconnected point tools and limited report customisation; each has a practical mitigation covered below.
- Choose a platform on data coverage across modules, statutory depth in Indian payroll, and how quickly you reach a dashboard leaders actually use, then on governance and customisation fit.
What HR Analytics in HRM Actually Means
HR analytics is the practice of collecting workforce data, testing it against a business question, and using the answer to change a decision. Inside an HRM, or human resource management system, that data is already being generated as a by-product of daily operations: every offer accepted, every shift regularised, every appraisal closed, every payroll input approved.
People analytics in HRM covers the same ground with a slightly wider remit. Classic HR reporting describes what the HR function did. People analytics asks what the workforce is doing and what it will cost or enable next. The distinction matters when you’re scoping a system, because one requires a report writer and the other requires connected data across modules.
Three things separate analytics from reporting in practice. Take an illustrative attrition figure:
- Reporting states a number. Attrition was 18% last year.
- Analytics explains the number. Attrition was 18%, concentrated in two grades, in three locations, among people with under 14 months of tenure and no internal movement.
- Strategic HR analytics changes a plan. Because that pattern holds, the hiring budget shifts, the pay range for those grades is revisited, and the first-year manager check-in becomes mandatory.
Gartner’s 2024 Top Priorities for HR Leaders research named strategic workforce planning and HR technology among the priorities HR leaders identified for the year. For a CHRO, that’s a practical signal. Workforce planning conversations are moving into the boardroom, and they can’t be held on numbers that take a week to assemble.
Why HR Analytics Works Better Inside the HRM System Than Beside It
A common starting point is exporting HR data into a business intelligence tool. That approach works, and for finance-grade scenario modelling it is often the right one. It also carries costs that show up quietly.
One employee identity, not three. When recruitment, payroll and performance each hold their own version of an employee record, every analysis begins with a reconciliation exercise. A single system of record, one place where the employee’s details live for every module, removes that step. Reconciliation is often where the reporting calendar loses its first week.
Numbers that match the payslip. If your cost-per-head analysis is built on an extract, it will eventually disagree with the payroll register, and that disagreement tends to surface in front of the CFO. Analytics that reads the live payroll and attendance tables produces figures that match what employees were actually paid.
Access control that HR can defend. Salary, disciplinary and health-related data carry real exposure. Keeping analysis inside the HR system means the same role-based permissions that govern the employee record govern the report, rather than a second permissions model maintained in a separate tool.
A shorter path from insight to action. A finding only pays for itself when something changes. Inside an HRM, an attrition risk flag can open a retention conversation, trigger a succession review or create a requisition. Outside it, the finding has to be emailed to someone who will act on it later.
Deloitte’s Global Human Capital Trends research has pointed to the gap between the volume of workforce data organisations hold and the decisions they actually make with it. For an HRIS owner, closing that gap depends less on analytical skill than on where the data sits, and that’s decided when you choose your system of record.
The Four Levels of HR Analytics Maturity in HRM
Treat analytics as a capability rather than a single dashboard project, because a dashboard is the output of that capability. Four levels work better as a planning device, each answering a different kind of question and each depending on the one below it.
- Descriptive: What happened?
- Diagnostic: Why did it happen?
- Predictive: What is likely to happen next?
- Prescriptive: What should we do, and can the system do part of it?
Capability is rarely even across an HR function. Descriptive reporting on payroll can be mature while diagnostic analysis of hiring quality is still done by hand. The ladder is diagnostic in itself: it tells you which single step is worth funding next.
Level 1: Descriptive Reporting on Core HR and Payroll Data
This is the foundation, and it’s unglamorous. Level 1 answers questions of record: how many people, in which entities, on what cost, with what attendance and leave positions.
Typical Level 1 outputs include headcount by entity, grade and location, joiners and leavers by month, cost to company by cost centre, leave liability, overtime hours, and statutory contribution summaries. In India, that last category carries specific weight:
- Provident fund contribution registers by establishment code.
- ESI contributions for eligible wage bands and covered locations.
- TDS computation and Form 16 preparation for the financial year.
- Gratuity liability by tenure band.
The mistake at this level is assuming it’s a solved problem. It’s solved only when the underlying master data is consistent: one grade structure, one location master, one set of employment types across every entity you run. Where an enterprise runs three payroll instances and two attendance tools, Level 1 reporting quietly becomes a monthly manual exercise, and nothing above it can be trusted.
A reasonable test: if your head of HR operations can produce an accurate headcount and cost-to-company split by entity and grade, unaided, in under an hour, Level 1 is in place.
Level 2: Diagnostic Analysis Across the Hire-to-Exit Lifecycle
Level 2 begins when you can connect data from one module to another without exporting anything. It answers why questions, and it’s often where the first genuinely useful insight appears.
Examples of diagnostic analysis that need cross-module data:
- Hiring source against first-year retention. Which sourcing channels produce people who are still with you at month 13, and which produce early exits that quietly inflate cost per hire.
- Onboarding completion against time to productivity. Whether new joiners who complete structured onboarding and their first learning path reach performance milestones faster.
- Attendance patterns ahead of resignation. Rising unplanned absence or declining shift adherence in the weeks before an exit, visible only when the leave and attendance records sit alongside the exit record.
- Appraisal ratings against pay movement. Whether your compensation cycle actually differentiates, or whether high and mid performers converge on the same increment.
- Manager span against team attrition. Whether exits concentrate under particular spans of control or particular tenure profiles in the manager population.
None of these are exotic analyses. They’re simply impossible when the applicant tracking system, the payroll engine and the performance module belong to three vendors and share nothing but an employee name spelled three ways. Level 2 is largely a data-integration achievement dressed up as an analytics achievement.
Level 3: Predictive Analytics for Attrition, Hiring Load and Workforce Cost
Level 3 uses historical patterns to estimate what happens next. It doesn’t require a data science team if the models sit inside the HR platform and are trained on your own history.
Three predictions are worth building first in Indian enterprises:
Attrition risk by segment. The useful output is a segment-level view rather than an individual score: which grades, locations, tenure bands and shift patterns are trending toward higher exit probability in the next two quarters. This lets Talent Acquisition start sourcing before the requisition arrives rather than after.
Hiring load and pipeline sufficiency. If you know historical offer-to-join ratios by role family and location, and you know the attrition forecast, you can estimate how many candidates need to enter the pipeline in a given month. For high-volume IT/ITeS or retail hiring, this converts recruiter capacity planning from guesswork into arithmetic.
Workforce cost projection. Payroll cost is not a straight line. Increment cycles, promotion movement, statutory revisions, shift premiums and variable pay all land at different times. A projection built on your own payroll history gives finance a defensible number for the annual operating plan.
Two cautions belong here. Predictions inherit the biases of the data they learn from, so any model influencing individual decisions needs human review and a documented rationale. Prediction quality also depends entirely on Levels 1 and 2 being stable. A forecast built on inconsistent location masters will be confidently wrong.
Level 4: Prescriptive Analytics and AI-Assisted Employee Service
Level 4 recommends an action and, in places, performs it. This is where analytics stops being a reporting function and becomes part of how the HR operation runs.
Prescriptive use cases look like this: a succession dashboard that flags critical roles with no ready-now successor and suggests candidates from the internal skills profile; a compensation planning screen that highlights where an increment recommendation sits outside the approved range before the manager submits it; a learning recommendation triggered by a skills gap identified in the appraisal cycle.
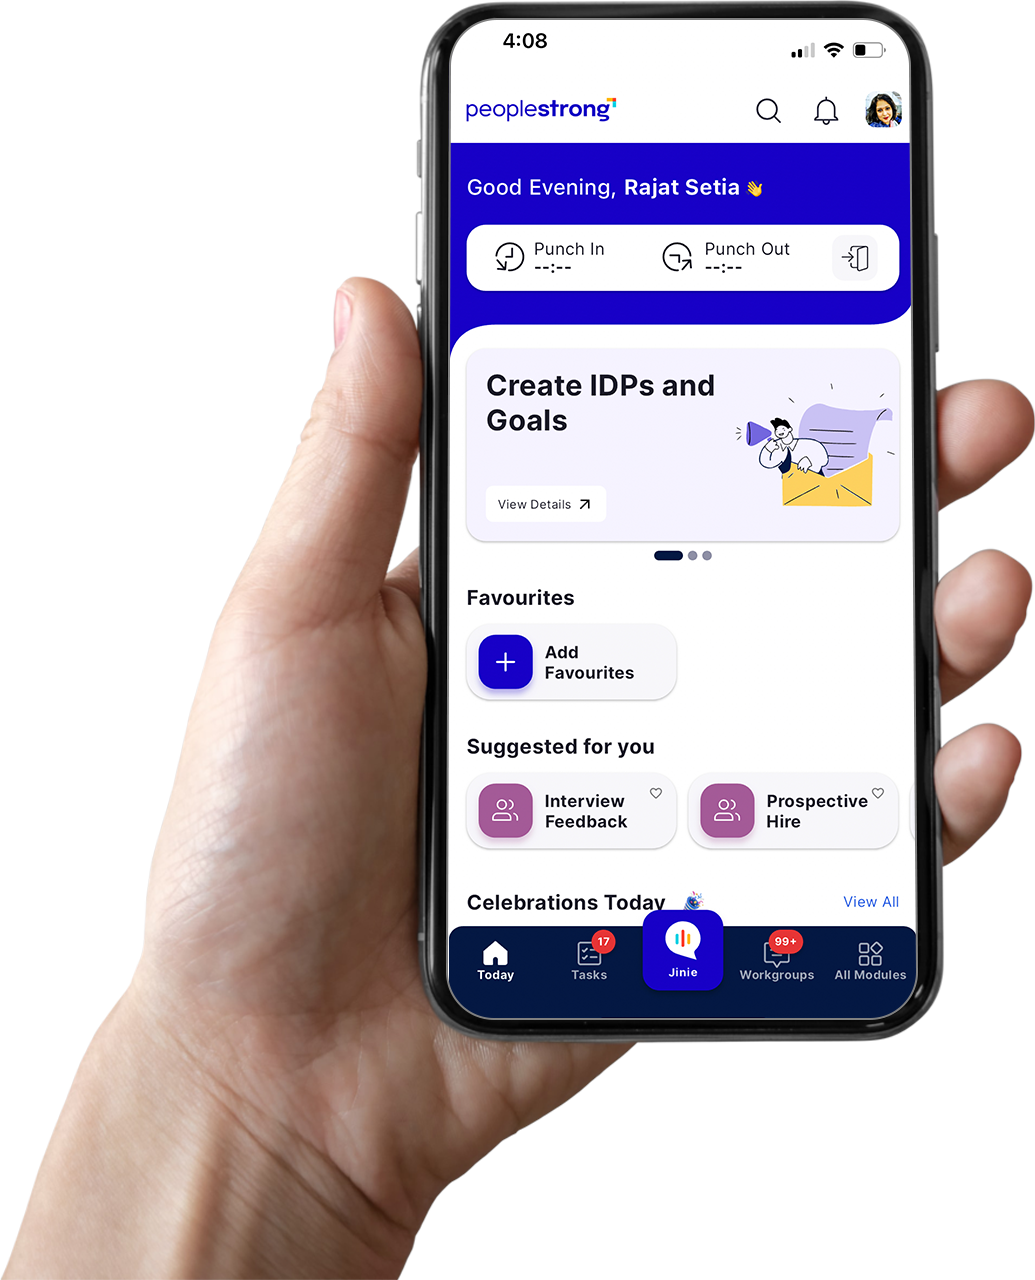
The employee service side matters just as much, and it’s easy to overlook. Every HR query an employee raises is both a service event and a data point. Jinie, PeopleStrong’s embedded HR AI agent, resolves employee queries on leave balances, payslips and policy questions around the clock, and PeopleStrong reports a reduction of roughly 60% in HR administrative load where it is deployed. Two things follow for an HR leader. The team gets hours back that were being spent on repeat queries, and the query log itself becomes analysable: a spike in payslip queries from one location after a statutory change tells you exactly where communication failed, without waiting for an engagement survey.
That’s the practical shape of Level 4. Analytics inside the workflow, acting on the same record the employee and the manager are already using.
HR Analytics Metrics That Matter at Each Maturity Level
Workforce analytics metrics are easy to over-collect. The discipline is picking metrics that a named decision-maker will act on, and retiring the rest. The table below maps a working set to the four levels.
| Maturity level | Representative metrics | Question it answers | Modules the data comes from |
| Level 1: Descriptive | Headcount by entity and grade, joiner and leaver counts, cost to company, absenteeism rate, overtime hours, leave liability, statutory contribution summaries | What is the current state of the workforce and its cost? | Core HR, Payroll, Leave and Attendance |
| Level 2: Diagnostic | Quality of hire by source, first-year attrition, time to fill by role family, internal mobility rate, training completion against performance movement, rating distribution by manager | Why is a number moving, and where is it concentrated? | Talent Acquisition, Onboarding, Learning, Performance, Core HR |
| Level 3: Predictive | Forecast attrition by segment, projected hiring demand, pipeline sufficiency ratio, projected payroll cost, bench strength against critical roles | What is likely to happen in the next two to four quarters? | Payroll, Performance, Talent Acquisition, Succession Planning |
| Level 4: Prescriptive | Retention actions triggered and completed, successor readiness coverage, skills gaps closed against recommended learning, HR query deflection rate and resolution time | What should we do next, and did the action work? | All modules, plus the AI agent layer |
Two metrics deserve a definitional note. Cost per hire, as defined in SHRM’s human capital benchmarking standard, is internal plus external recruiting costs divided by the number of hires in a period. Enterprises that calculate it differently across business units cannot compare results, which is why the definition should live in the system rather than in a recruiter’s spreadsheet. Attrition denominators vary just as widely. Fix yours once and apply it everywhere.
HR Analytics Examples From Indian Enterprises: Manufacturing, BFSI, IT/ITeS and Retail
Sector context changes which questions matter. The following are representative patterns of how analytics gets used across PeopleStrong’s focus industries in India.
Manufacturing
The workforce is mixed, and the two halves behave differently. Shopfloor analysis centres on shift adherence, overtime concentration, contractor versus permanent cost ratios, and absenteeism by line or plant. A common use case: correlating overtime spikes in a specific shift with attrition in the following quarter, then adjusting staffing ratios before the exits happen. On the white-collar side, the questions look conventional, which is exactly why a single system that handles both matters more here than in most sectors.
BFSI
Compliance and control dominate. Analytics is used for reporting that supports audit requirements on access and role changes, mandatory certification currency across branches, and attrition in customer-facing and regulated roles. Branch-level reporting is a persistent need, because a national average tells a regional head nothing actionable. The security requirement also argues strongly for keeping analysis inside the HR system’s permission model rather than replicating sensitive data elsewhere.
IT/ITeS
Hiring volume and skills currency drive the analysis. Typical work includes pipeline sufficiency by skill and location, offer-to-join ratios by source, billability against bench cost, and skills coverage for upcoming project demand. Attrition forecasting has direct commercial consequence here, since an unplanned exit on a billed project carries revenue risk as well as replacement cost.
Retail
Distributed frontline teams create a different problem: many small locations, high turnover, thin store-level HR support. Analytics focuses on store-level staffing against footfall or sales hours, scheduling compliance, early-tenure attrition, and the cost of vacancy in customer-facing roles. Mobile-first data capture is a precondition. If attendance isn’t recorded reliably at the store, none of the downstream analysis holds.
What Slows HR Analytics Down in HRM, and How to Mitigate It
Honest constraints, with practical responses.
Inconsistent master data across entities. Different grade nomenclature, duplicate location codes and multiple employment-type definitions make consolidated reporting unreliable. Mitigation: run a master data clean-up as a defined project before the analytics rollout, and assign ownership of each master to a named person in HR operations, not to IT alone.
Three or more disconnected HR tools. Enterprises evaluating a change frequently run separate systems for payroll, attendance and recruitment. Every cross-module question then becomes a manual join. Mitigation: sequence consolidation by data dependency. Core HR and payroll first, attendance next, then Talent Acquisition and Performance.
Limited depth of report customisation. Standard reports don’t always match how a specific business wants to see its numbers, and depth of report customisation is a constraint worth testing during evaluation, PeopleStrong included. Mitigation: agree a short list of board-level reports during implementation, confirm in the demo that each can be built with your own data structure, and use the platform’s export and integration options for the genuinely bespoke analysis finance wants to model itself.
Performance under heavy reporting load. Large reports run against live data can be slow, and users sometimes encounter session timeouts during long analytical sessions. Mitigation: schedule heavy consolidated reports off-peak, keep interactive dashboards scoped to the dimensions leaders actually filter on, and agree performance expectations for large data volumes during evaluation rather than after go-live.
Interface familiarity across a mixed workforce. Adoption suffers when frontline users find data entry effortful, and parts of any long-established enterprise platform, PeopleStrong included, can feel less contemporary than a newer mid-market tool. Mitigation: invest in mobile capture flows for attendance and leave, and use the AI agent for routine queries so that employees who rarely log in aren’t forced to work through a full portal for a payslip.
Analytics with no owner. Dashboards get built, then quietly stop being opened. Mitigation: attach every dashboard to a recurring decision forum and a named owner. If no forum uses it within a quarter, retire it.
A 90-Day Plan to Move Your HR Analytics Up One Level
The goal is one level, not four. Attempting all four at once tends to produce dashboards nobody trusts.
Days 1 to 30: Fix the base and choose the question
Audit where employee data currently lives and how many versions of the employee record exist. Standardise the grade, location and employment-type masters. Then pick two or three business questions with named owners, such as why early-tenure attrition is concentrated in two plants, or what next year’s payroll cost looks like under the approved increment policy. Write down the metric definitions you’ll use, including the attrition denominator and the cost-per-hire formula.
Days 31 to 60: Build the connected view
Get the data for those questions flowing into one place inside the HR system. For a Level 1 to Level 2 move, that usually means connecting Core HR and payroll data to attendance and recruitment records. Build the minimum reporting needed to answer the chosen questions, validate the numbers against payroll registers and statutory filings, and have HR operations sign off that the figures reconcile. Validation is the step most often skipped, and the one that determines whether leaders believe the output.
Days 61 to 90: Put it in front of a decision
Present the analysis at a forum that makes a real decision: the monthly business review, the workforce planning session, the compensation committee. Record what changed as a result. Then instrument the action so you can measure whether it worked, and add a second question to the queue. Capability compounds from here, because the data foundations built for the first question serve the next three.
Choosing an HRM Platform With HR Analytics Built In
Enterprise HR platforms differ less in whether they offer analytics and more in how much of the employee lifecycle the analytics can see. The overview below covers platforms typically evaluated by Indian enterprises above 1,000 employees.
| Platform | Best for | Analytics strengths | Typical company size |
| PeopleStrong | Indian enterprises wanting one system of record across the full hire-to-exit lifecycle | Cross-module reporting spanning Core HR, payroll, attendance, hiring, performance, learning and succession; AI-assisted employee service through Jinie | 1,000 to 10,000+ employees |
| Workday | Large multinationals aligning workforce and financial planning | Workforce planning and reporting across a wide global footprint | Large multinational enterprises |
| SAP SuccessFactors | Organisations already standardised on SAP for finance or operations | Workforce analytics and planning modules that connect to the wider SAP data estate | Large multinational enterprises |
| Oracle Fusion Cloud HCM | Enterprises running Oracle ERP that want HR data in the same reporting layer | HR analytics delivered alongside Oracle’s broader analytics tooling | Large multinational enterprises |
| ZingHR | Indian enterprises prioritising payroll-led deployment | Payroll and workforce reporting tuned to Indian statutory requirements | Mid to large Indian enterprises |
PeopleStrong
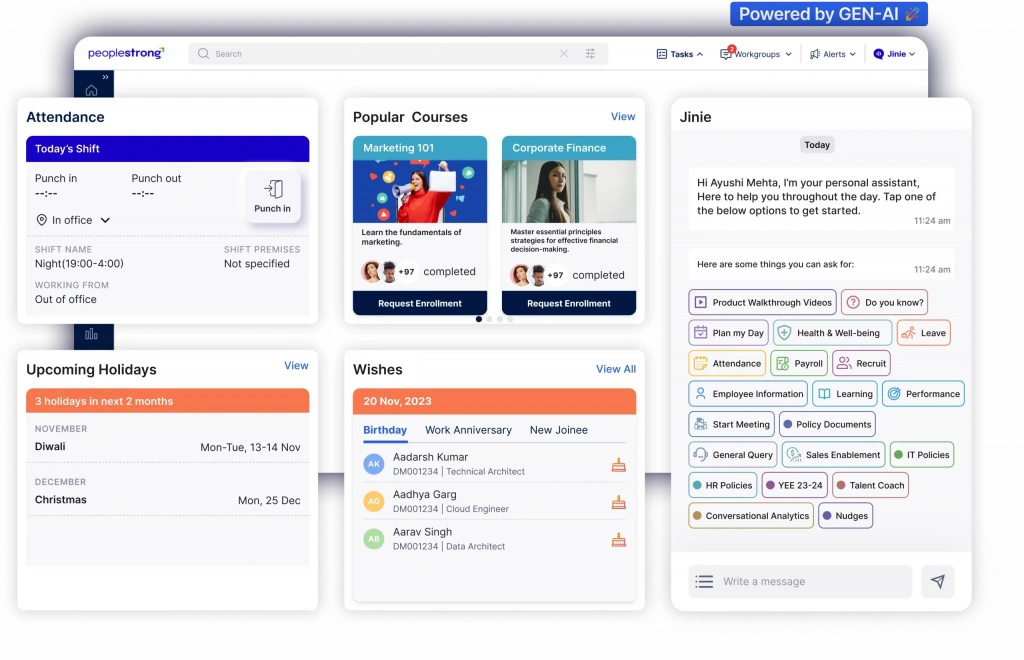
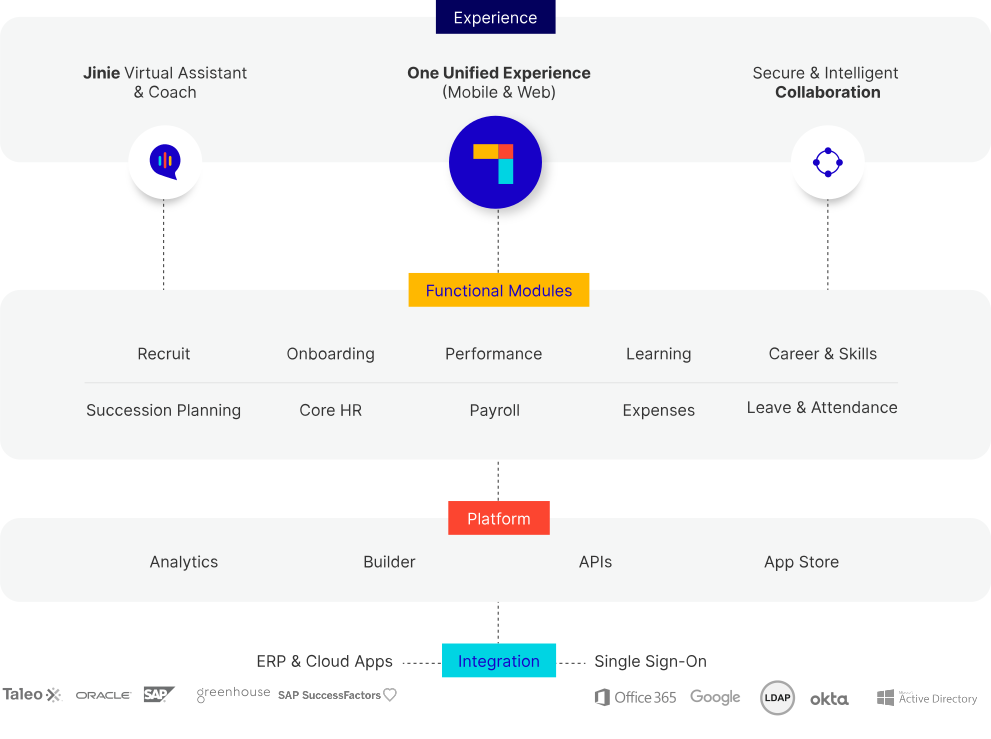
You get workforce metrics that read from the same records payroll and attendance already run on, which removes the reconciliation step before a number can be discussed at a leadership review. Analytics spans Core HR, Payroll and Workforce Management, Leave and Attendance, Talent Acquisition, Onboarding, Performance and Talent Management, Learning, Compensation and Succession Planning on one platform. Indian statutory handling for provident fund, ESI, TDS and gratuity is built into the payroll engine, so compliance-linked reporting draws on the same data as the filings themselves. Jinie resolves routine employee HR queries around the clock, with a reported reduction of roughly 60% in HR administrative load, which frees HR operations time for the analysis itself while the query data feeds back as a service signal. PeopleStrong currently serves 500+ enterprise customers covering more than 2 million employees across 10 countries, and has been named a Customers’ Choice in Gartner’s Voice of the Customer for Cloud HCM Suites for enterprises with 1,000+ employees for four consecutive years, 2022 through 2025. For a buyer, that recognition means peer feedback from the same size band is available to test against your own shortlist. Ideal for: Indian enterprises of 1,000 to 10,000+ employees consolidating multiple HR and payroll tools into one system of record with analytics across the lifecycle.
Workday
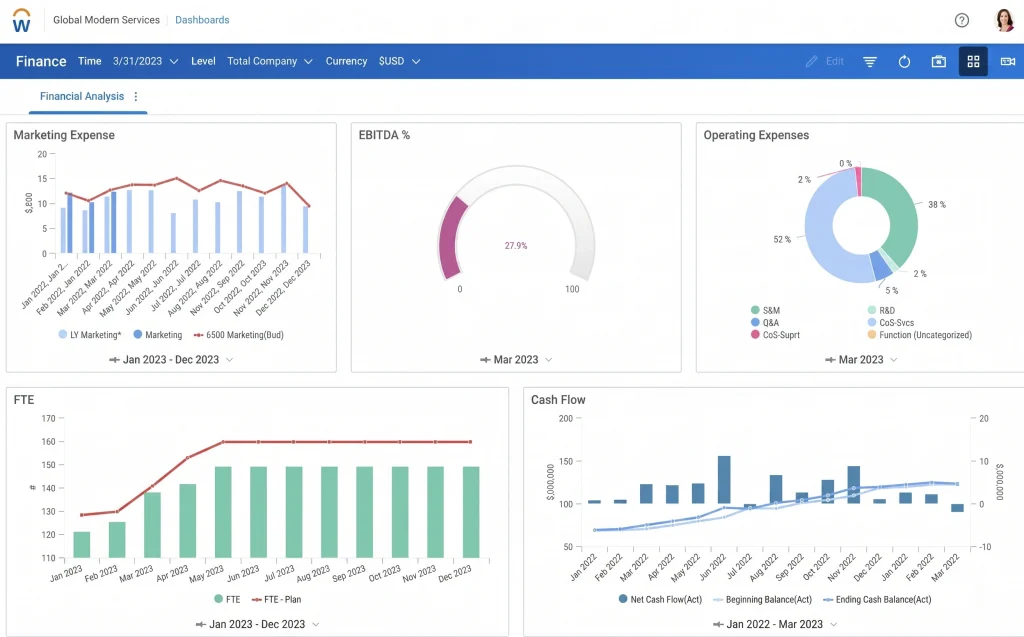
Suited to organisations that need workforce and financial planning to sit in the same conversation across many countries. The platform has workforce planning, reporting and analytics capability across a broad global footprint, with configuration typically handled through implementation partners. Ideal for: large multinational enterprises with in-house analytics capability and a global operating model.
SAP SuccessFactors
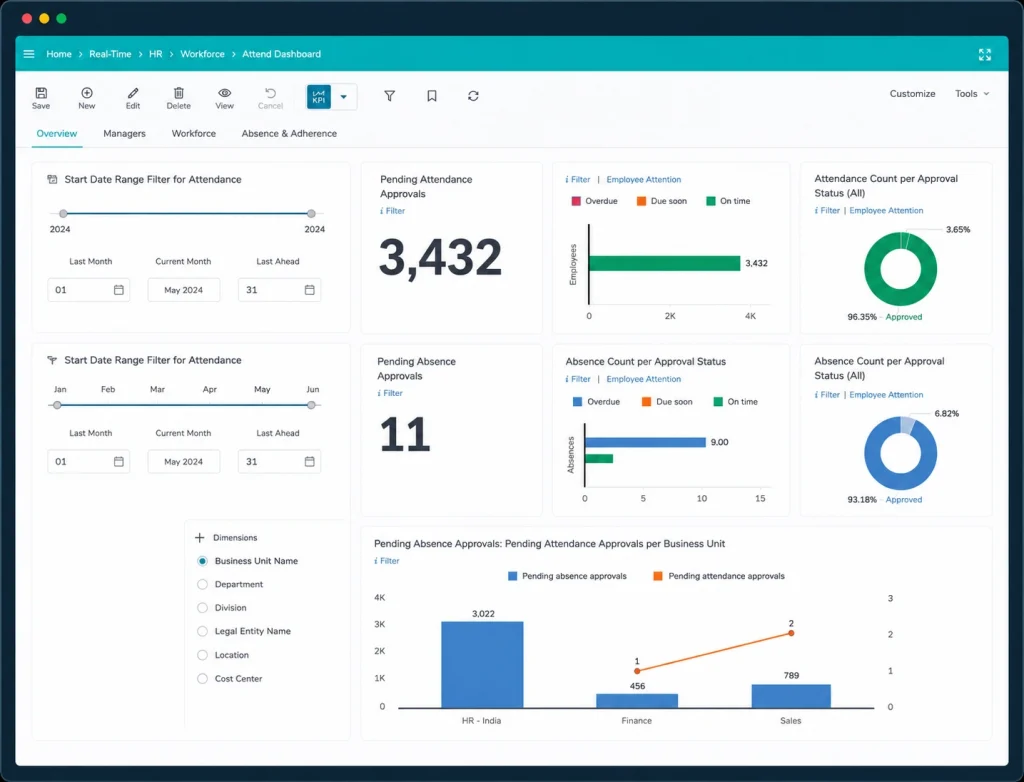
Useful where HR data needs to join an existing SAP landscape for finance or supply chain reporting. Workforce analytics and planning modules are available alongside the core HCM suite, and reporting can draw on the wider SAP data environment. Ideal for: multinational enterprises already standardised on SAP and staffing a dedicated HRIS function.
Oracle Fusion Cloud HCM
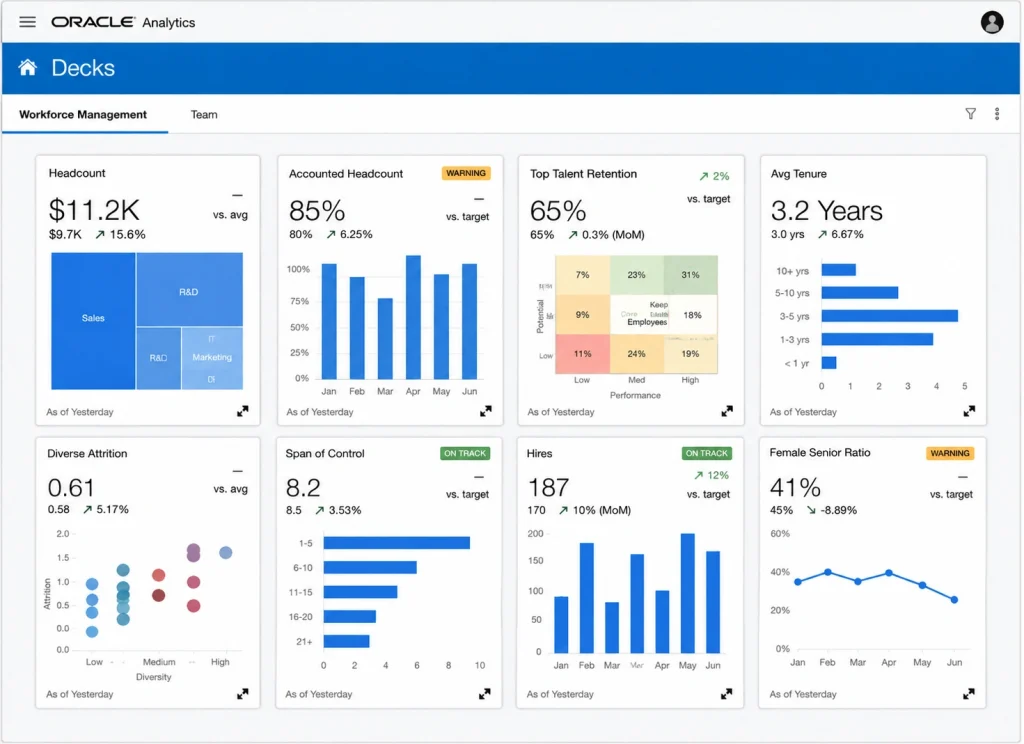
Appropriate for enterprises that want HR metrics presented in the same analytics layer as finance and operations data. The suite includes HR analytics delivered through Oracle’s broader reporting tooling. Ideal for: large enterprises running Oracle ERP with an established data and analytics team.
ZingHR
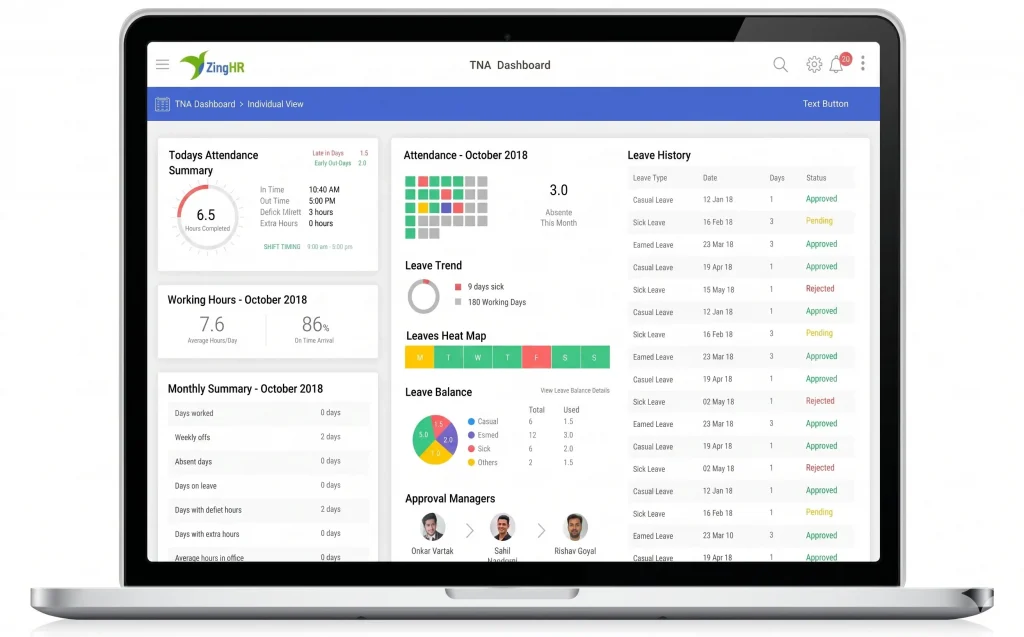
Focused on Indian statutory payroll and workforce reporting, with deployment often led by the payroll requirement. Reporting covers payroll, attendance and core workforce data. Ideal for: mid to large Indian enterprises where payroll processing is the primary driver of the HR technology decision.
A note on smaller and growing teams: Keka, greytHR and Zoho People serve Indian organisations below roughly 500 to 1,000 employees, with ease of use and quick setup as common selling points. They’re built for a different headcount band from the enterprise platforms above, which is why they sit outside the primary comparison rather than inside it.
The Decision Factors That Should Drive Your Analytics Choice
Weigh five things, in this order.
Data coverage across the lifecycle. Count how many of your workforce questions require data from more than one module. If most of them do, a platform that holds recruitment, payroll, attendance, performance and learning on one record will answer them; a reporting tool bolted onto fragmented systems will not.
Statutory depth in your payroll engine. Compliance-linked reporting is only as good as the calculation underneath it. Confirm during evaluation that provident fund, ESI, TDS and gratuity handling reflects your actual entity structure and state coverage, and that reports draw from the same data as your filings.
Time to a dashboard leaders use. Ask how long it takes to produce a validated headcount and cost view by entity and grade, and what has to be true about your data first.
Governance and access control. Salary and disciplinary data should be governed by one permissions model, not replicated into a second tool with its own rules.
Customisation fit for your top reports. Name your five board-level reports and confirm each can be built on your data structure during the demo, not after go-live.
If your organisation runs multiple entities across Indian states, mixes shopfloor and office populations, and currently reconciles headcount and cost by hand each month, the case for analytics inside the HR system of record is strongest. If you operate across many countries with a dedicated analytics team and a global finance model already in place, a global suite may fit that shape better. To see how cross-module reporting behaves against your own multi-entity payroll, shift attendance and attrition scenarios, schedule a demo of PeopleStrong’s HR Analytics and Core HR platform.
FAQs
What is the difference between HR analytics and people analytics?
The two terms are often used interchangeably, with a difference of emphasis. HR analytics tends to describe measurement of HR processes such as time to fill, payroll cost and absenteeism, while people analytics usually covers wider workforce questions including productivity, skills coverage and organisational design. In an HRM context both draw on the same underlying employee record, so the practical distinction is scope rather than technology.
Do you need a data scientist to run HR analytics in an HRM?
Not for the first three levels. Descriptive and diagnostic analysis needs clean master data and a report writer inside HR operations, and predictive models built into the HR platform are trained on your own history without requiring a modelling team. A data scientist becomes useful when you want custom models, external data blending or statistical validation of an intervention’s impact.
How many HR metrics should an enterprise actually track?
Fewer than a first dashboard project usually produces. A working rule is that every metric on a leadership dashboard should have a named owner and a forum where it changes a decision; if neither exists, retire it. A board-level set of ten to fifteen metrics is usually enough, with deeper operational sets held by HR operations, Talent Acquisition and payroll teams.
Can HR analytics work if payroll sits with an outsourced provider?
Yes, provided the payroll data returns to your system of record at employee level rather than as summarised journals. Managed payroll services that process on the same platform you use for Core HR keep that link intact, so cost analysis stays connected to headcount and attendance without a monthly import exercise. Where payroll is genuinely external, agree the data feed format and frequency before you design cost reporting.
How long does it take to see value from HR analytics in HRM?
Enterprises that scope one or two specific business questions typically reach a validated, decision-ready answer within a quarter, assuming master data is consistent. The longer variable is data clean-up: where multiple entities use different grade and location structures, that work alone can take several weeks. Attempting all four maturity levels at once usually extends the timeline rather than shortening it.