











 About Us
 Brand
Brand
 Career
 Contact Us



 +91-7314623098






The monthly workforce reports land, and the headcount figures don’t agree. Your head of HR operations traces one number to the payroll run and another to the attendance system, and neither matches what finance used in the quarterly review. The gap is small. A few dozen people, spread across plants and branch offices. It’s still enough that the attrition analysis prepared for the board has to be re-checked line by line before anyone signs off. Nobody was careless. The employee record simply lives in several tools that were never built to agree with one another, and that’s what turns workforce reporting into a monthly reconciliation exercise instead of a source of answers.
If you’re evaluating the best HR analytics software in India for a workforce of roughly 1,000 to 10,000-plus people, this shortlist is written for you: CHROs, HRIS and HR operations leaders, and the CIO who has to sign off on data security and integrations. The scope is India only. The statutory reporting load on Indian enterprises, provident fund filings and state-wise professional tax among them, shapes what an analytics platform actually has to produce. Rather than ranking tools in a flat list, the sections below group them by how they’re built and bought, because that choice determines most of what you’ll live with afterwards.
TLDR
- Indian enterprises buy HR analytics in four structurally different ways: HCM-native analytics on a single employee record, analytics modules inside global suites, standalone people analytics and BI layers, and reporting built into mid-market HRMS tools.
- Platforms covered at enterprise scale include PeopleStrong, ZingHR, Ramco HCM, Workday, SAP SuccessFactors, Oracle Fusion Cloud HCM, Visier, Crunchr, Microsoft Power BI and Tableau; Keka, greytHR, HROne and Zoho People are treated separately as options for smaller or growing teams.
- The main decision factor is whether payroll cost, attendance, hiring and performance data already share one employee record, or whether you’re prepared to build and maintain the links between separate systems yourself.
- For enterprises that want workforce metrics connected to the full hire-to-exit stack without running a separate data programme, HCM-native analytics is usually the shorter path; PeopleStrong has been named a Gartner Peer Insights Customers’ Choice for cloud HCM suites in 1,000+ employee enterprises four years running.
- Work through the data readiness checklist in this piece before you shortlist anything, since identifier consistency, agreed metric definitions and historical data depth shape what any platform can produce.
What ‘HR Analytics Software’ Means Once You Cross 1,000 Employees
Below a few hundred employees, HR analytics usually means a set of reports: headcount, attrition, leave balances, a payroll register. Past 1,000 employees, and particularly across multiple legal entities and states, the definition changes in three ways.
First, the questions get comparative. Not “what is our attrition”, but “which plants, grades and managers account for most of our first-year exits, and what did replacing those people cost in hiring spend and overtime”. Answering that means joining recruitment data to payroll data to attendance data.
Second, the audience widens. Business unit heads want their own slice, finance wants cost-to-company movement by cost centre, and the works committee or compliance lead wants register-level detail. So you need role-based access, not one shared dashboard.
Third, the data has to be defensible. A workforce number quoted to the board, an auditor or a labour inspector needs a traceable path back to a source record, and reports assembled by hand in spreadsheets don’t survive that scrutiny well.
Enterprise HR analytics software, then, is really three layers working together: a clean employee record, a reporting engine that can cut it by entity, location, grade and cost centre, and a delivery layer (dashboards, scheduled reports, self-service queries) that people outside the HR team will actually use.
The Four Ways Indian Enterprises Buy HR Analytics, and the Trade-Off Behind Each
This shortlist groups the options into four buying models. Each carries a predictable trade-off.
- Model 1: HCM-native analytics. Analytics ships inside the core HR and payroll platform, reading the same employee record. You trade some flexibility in visual design for far less data-engineering work.
- Model 2: Global suite analytics modules. Deep analytics built into a global HCM suite. You get considerable functional range across countries, and you take on a larger configuration and change-management programme to get there.
- Model 3: Standalone workforce analytics and BI layers. A dedicated analytics product sitting on top of whatever HR systems you already run. You gain modelling freedom and independence from your HRMS roadmap, and you own the integrations, definitions and refresh schedules.
- Model 4: Mid-market HRMS reporting. Reporting bundled into a growth-stage HR platform. Quick to stand up and well suited to smaller organisations, with reporting depth tuned to that size band rather than to multi-entity enterprise complexity.
The rest of this shortlist works through each model, the platforms in it, and who each one suits.
Model 1: HCM-Native Analytics Built on a Single Employee Record
Here, workforce analytics isn’t a separate purchase. Hiring, onboarding, payroll, attendance, performance and exit data all sit in one system, so a report on cost per hire or absenteeism by shift doesn’t require anyone to reconcile identifiers between tools first. For HR teams without a dedicated data engineering function, this is usually the shortest route from question to answer.
PeopleStrong
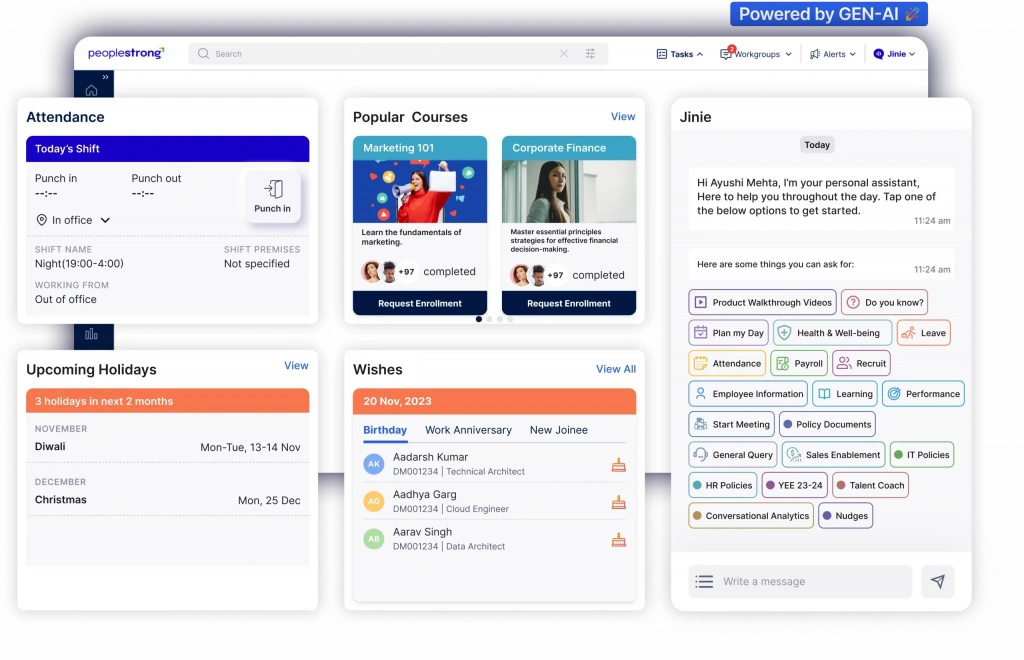
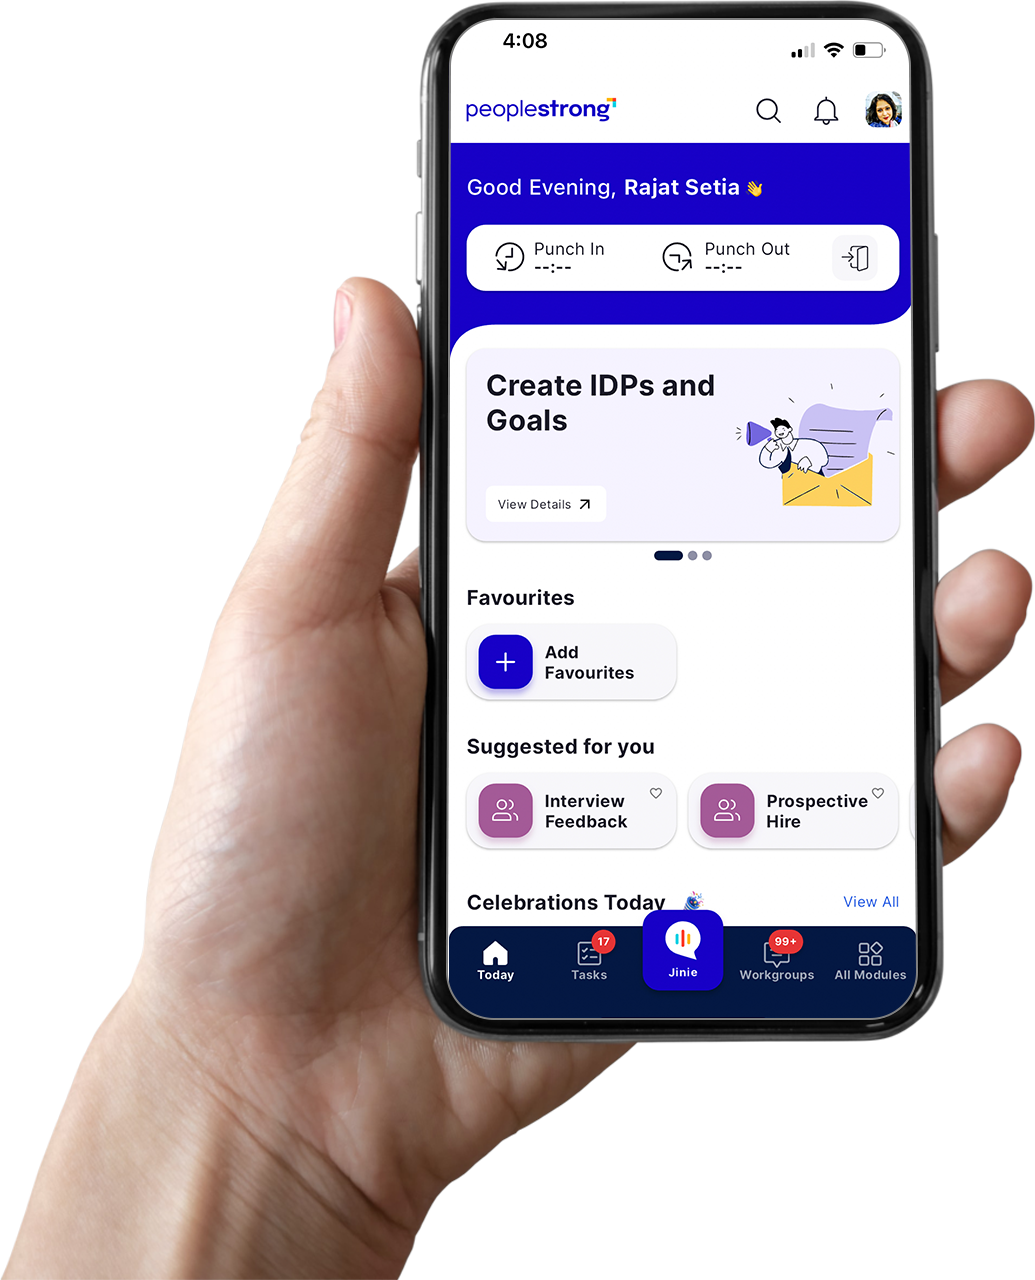
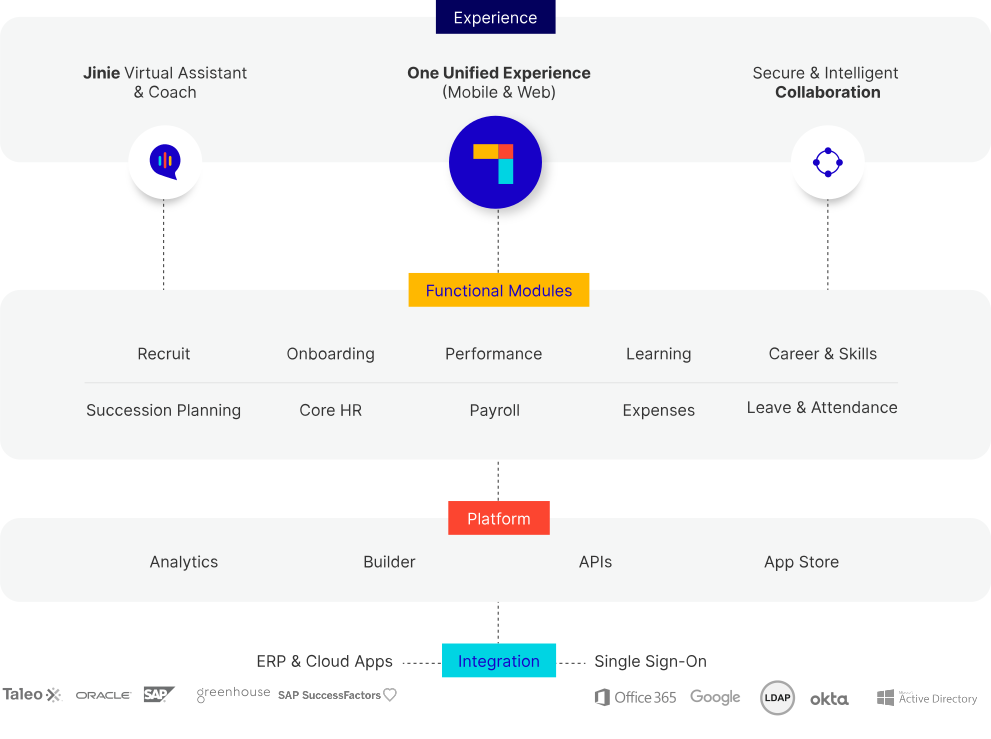
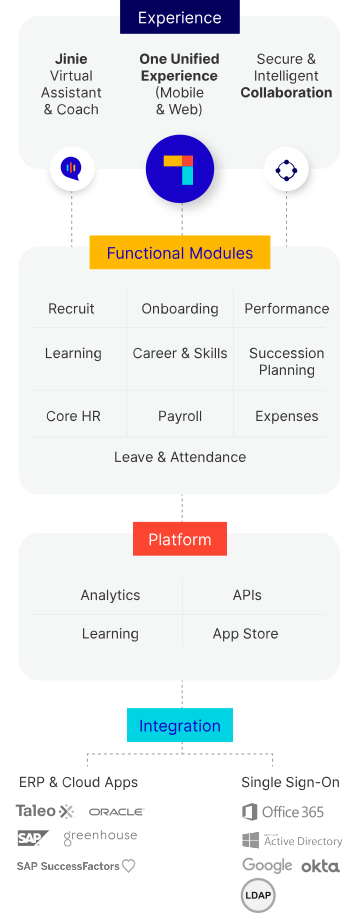
PeopleStrong is a unified hire-to-exit Human Capital Management platform built for large enterprises in India, with core HR, payroll and workforce management, talent acquisition, performance and talent management, learning, leave and attendance, compensation and succession planning running on one employee record. HR analytics draws on all of those modules, so workforce metrics can be cut by legal entity, location, grade, cost centre and business unit without exporting data first.
Statutory outputs are produced from the same payroll engine that feeds the dashboards, which keeps the compliance view and the management view consistent:
- Provident fund data.
- Employees’ state insurance data.
- Professional tax by state.
- Tax deducted at source registers.
Jinie, PeopleStrong’s embedded HR AI agent, handles routine employee queries on leave, payslips and policy around the clock, and can reduce HR administrative load by roughly 60%. For an analytics buyer, the practical effect is that query volume and resolution patterns become data in their own right, showing where policy is unclear or where a location generates disproportionate HR service demand.
PeopleStrong currently serves more than 500 enterprise customers, manages over 2 million employees and operates across 10 countries. Gartner Peer Insights named it a Customers’ Choice in its Voice of the Customer report for cloud HCM suites in 1,000+ employee enterprises in 2022, 2023, 2024 and 2025. That recognition is based on verified customer reviews rather than analyst opinion, which matters if peer experience at your size band is part of your evaluation criteria.
Ideal for: Indian enterprises of 1,000 to 10,000-plus employees, particularly in manufacturing, BFSI, pharma and healthcare, IT services and retail, that want analytics connected to payroll and attendance rather than assembled on top of them.
ZingHR
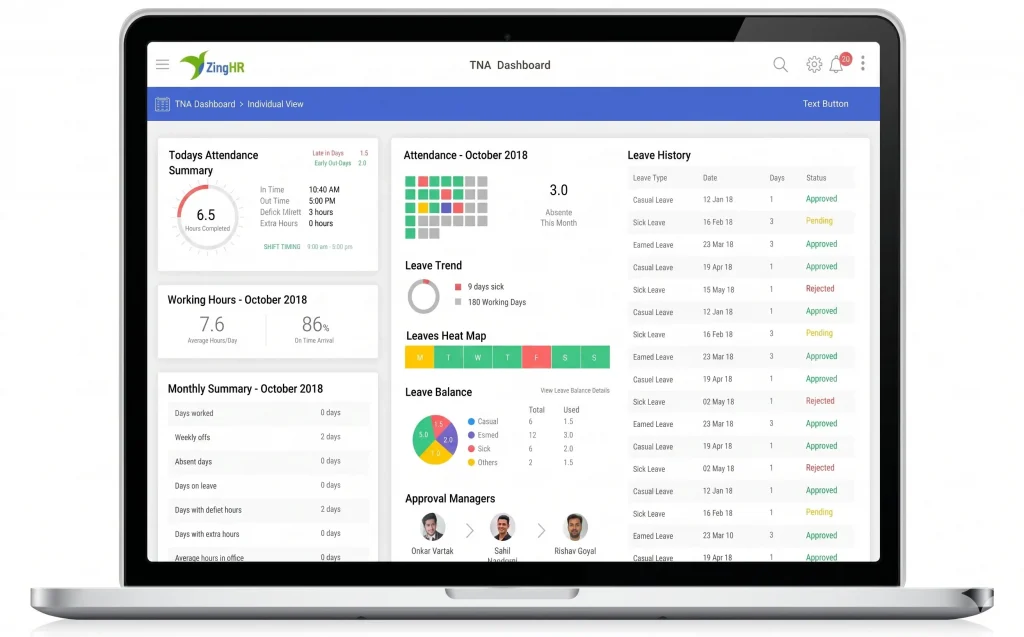
ZingHR is an India-headquartered HCM platform covering core HR, payroll, recruitment, performance and workforce management, with reporting and dashboards built over the same platform data. Its mobile-first orientation suits organisations with large deskless or field-based workforces, where attendance and geo-tagged shift data feed operational reporting.
Ideal for: Enterprises with substantial frontline or distributed workforces that want payroll and attendance reporting inside the same platform they use for day-to-day HR transactions.
Ramco HCM
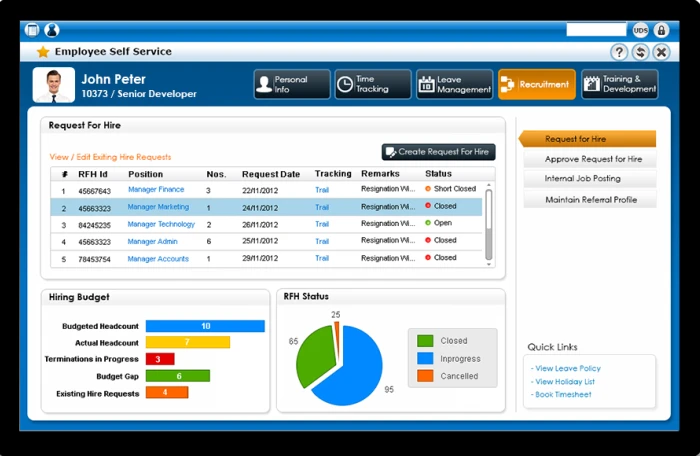
Ramco HCM provides global payroll and core HR with analytics and dashboards covering workforce cost, headcount and payroll variance. It suits asset-intensive organisations in manufacturing, logistics and aviation, and groups already running other Ramco enterprise applications, where shared master data cuts integration effort.
Ideal for: Process and asset-heavy enterprises, especially those standardising on a single vendor across HR and other enterprise systems.
Model 2: Global Suite Analytics Modules
Global HCM suites include analytics as a deep, configurable capability spanning workforce planning, diversity reporting, compensation modelling and multi-country consolidation. The pay-off is range. If you operate across many countries and need one global reporting standard, this model is built for exactly that. The commitment is a larger implementation programme, usually partner-led, plus ongoing configuration ownership inside your HRIS team.
Workday
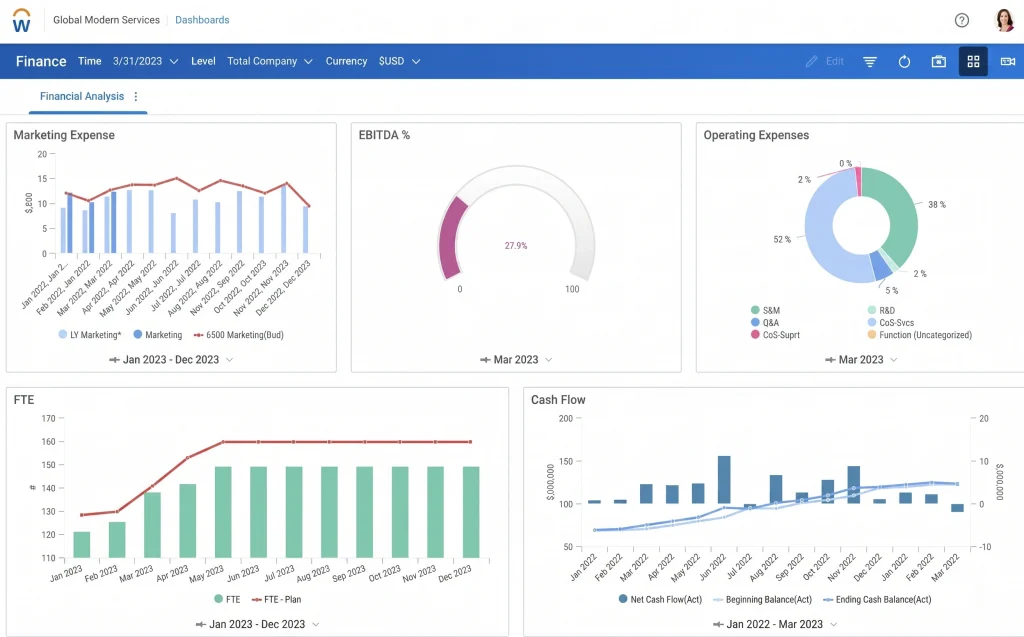
Workday combines HCM, payroll, talent management and workforce planning, and its analytics layer reports on live transactional data, so management dashboards reflect the current state of the worker record rather than a nightly extract. Prism Analytics brings external data sets alongside HR data, which means workforce numbers can be reported next to operational ones in the same view. Workforce planning tools support scenario modelling on headcount and cost.
Ideal for: Multinationals with sizeable HRIS and analytics teams that need one global workforce reporting standard across many countries.
SAP SuccessFactors
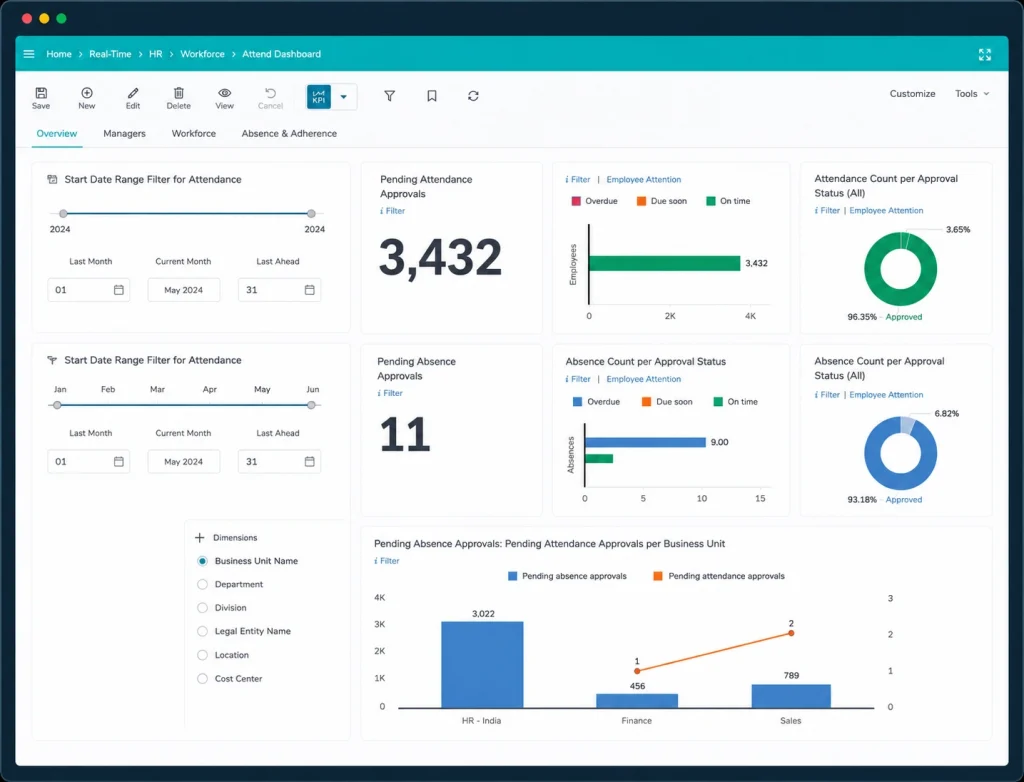
SAP SuccessFactors offers people analytics with prebuilt workforce metrics, story-style reporting and planning capability, and connects to the wider SAP estate so workforce cost can be read against finance data. Its talent management modules feed performance, succession and learning data into the same analytics layer.
Ideal for: Enterprises already standardised on SAP for finance or operations that want workforce and financial reporting aligned under one vendor.
Oracle Fusion Cloud HCM
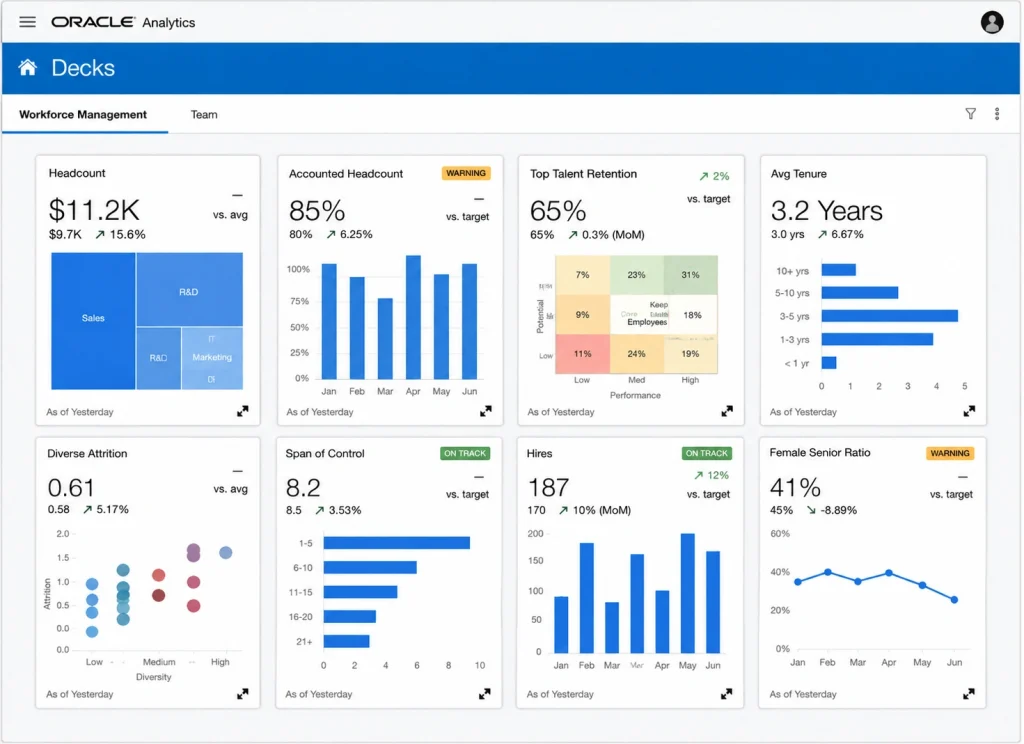
Oracle Fusion Cloud HCM includes embedded analytics and Oracle Fusion HCM Analytics, a prebuilt warehouse that gives your team ready-made workforce, recruitment, compensation and diversity reporting rather than a data model to build first. Organisations running Oracle ERP alongside it can report on workforce cost and operational data through a shared analytics platform.
Ideal for: Large Oracle-aligned enterprises that want a prebuilt analytics warehouse rather than building one from scratch.
Model 3: Standalone Workforce Analytics and BI Layers
This model separates analytics from the system of record. You keep your existing HR, payroll and attendance tools, and a dedicated analytics product or general business intelligence platform sits above them. It suits organisations that have several HR systems they can’t consolidate quickly, or that want analytical models independent of any single vendor’s roadmap. The work you take on is the data plumbing: connectors, common definitions of headcount and attrition, and a refresh schedule someone owns.
Visier
Visier is a dedicated people analytics platform with prebuilt workforce metrics, guided analysis and benchmarking, designed so HR business partners and line managers can explore questions without writing queries. It connects to multiple source systems and resolves them into a single workforce model, so one definition of headcount holds across all of them.
Ideal for: Enterprises running more than one HR or payroll system that want a common analytics model across all of them.
Crunchr
Crunchr provides people analytics dashboards, workforce planning and self-service exploration, with attention to data privacy controls and role-based access. It suits HR analytics teams that want prebuilt metric libraries rather than custom-built reporting.
Ideal for: Organisations with a defined people analytics function that want packaged metrics and planning tools on top of existing systems.
Microsoft Power BI
Power BI is a general business intelligence platform used for HR dashboards, and it fits enterprises already on Microsoft 365 and Azure. It connects to payroll and HRMS databases, supports row-level security so each viewer sees only the employee records they’re entitled to, and lets your team model whatever metric definitions the business agrees on.
Ideal for: Enterprises with internal BI capability and a Microsoft-centred data estate that want full control over HR metric definitions.
Tableau
Tableau is a visual analytics platform for exploratory workforce analysis and executive dashboards, with detailed charting and interactivity. It works best where a central analytics group prepares the data, rather than HR teams connecting to HR systems directly.
Ideal for: Organisations with a central analytics team already standardised on Tableau for enterprise reporting.
Model 4: Mid-Market HRMS Reporting for Growing Teams
These platforms are built for smaller and growing organisations, and their reporting is scoped accordingly. They’re included here because many Indian enterprises started on one of them and are now assessing whether reporting depth, rather than core HR functionality, has become the constraint. They sit outside this shortlist’s 1,000-plus employee scope and aren’t compared against the enterprise platforms above on the same terms.
Keka
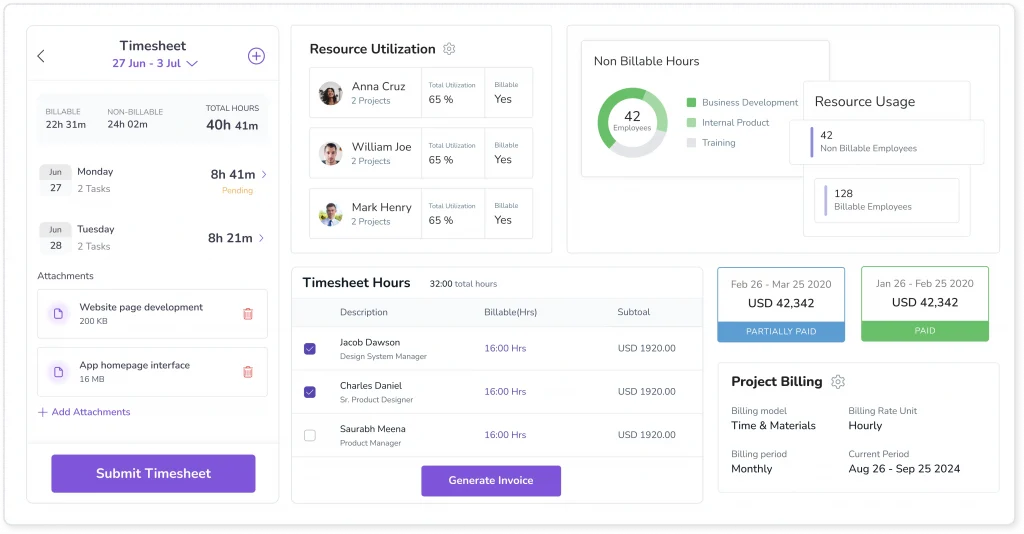
Keka covers core HR, payroll, performance and attendance with dashboards and standard reports on headcount, attrition and payroll. It’s positioned around a straightforward interface and quick setup.
Ideal for: Growing companies that want straightforward HR reporting alongside day-to-day HR administration.
greytHR
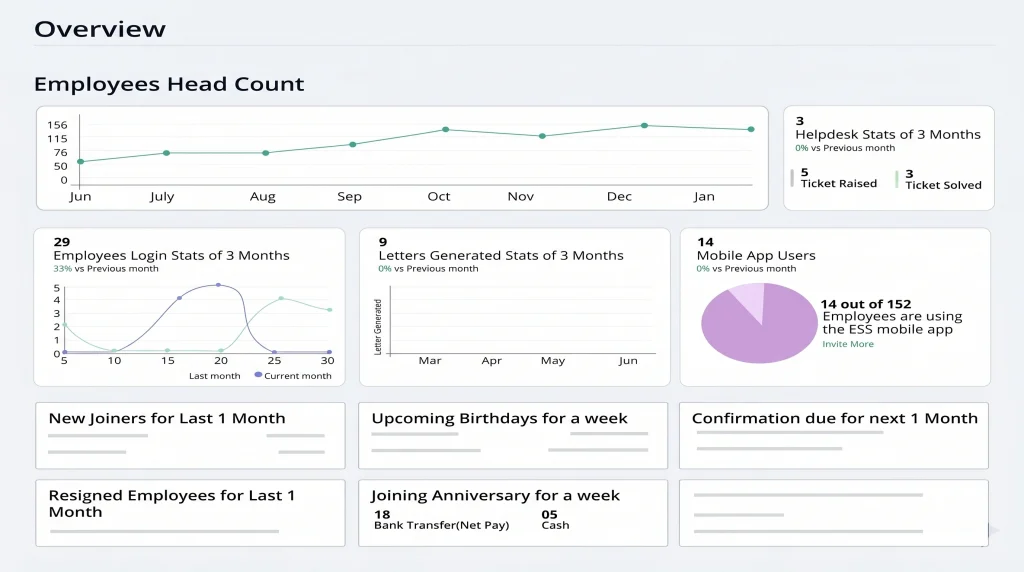
greytHR focuses on payroll and compliance for Indian businesses, with payroll registers, statutory reports and leave and attendance reporting.
Ideal for: Small and mid-sized Indian organisations where payroll accuracy and statutory outputs are the main reporting requirement.
HROne
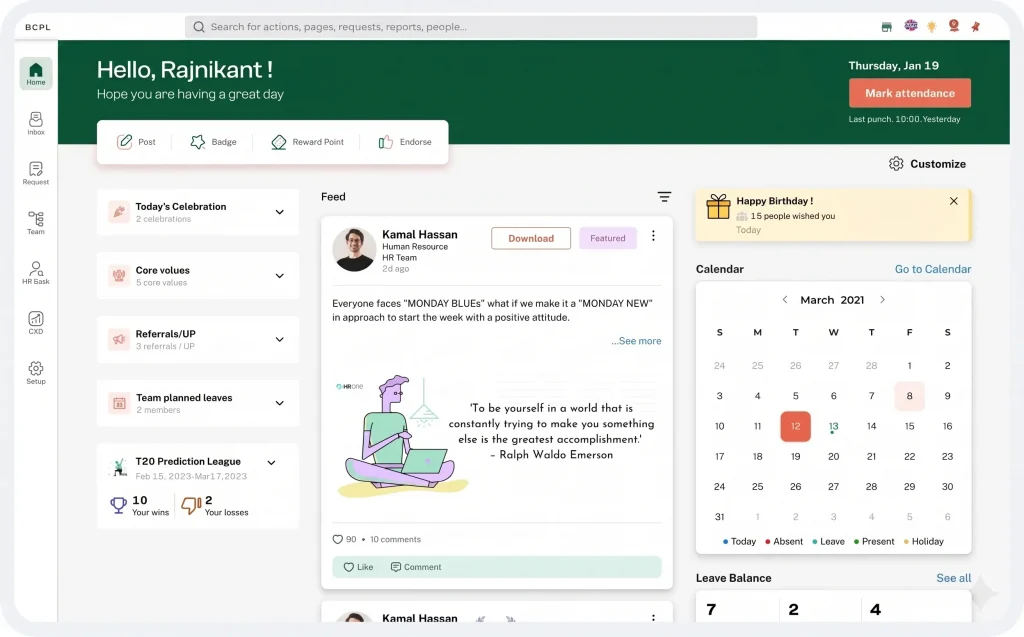
HROne provides core HR, payroll, attendance and performance with configurable reports and analytics dashboards for mid-sized teams.
Ideal for: Mid-sized Indian companies consolidating several HR spreadsheets and tools into one platform.
Zoho People
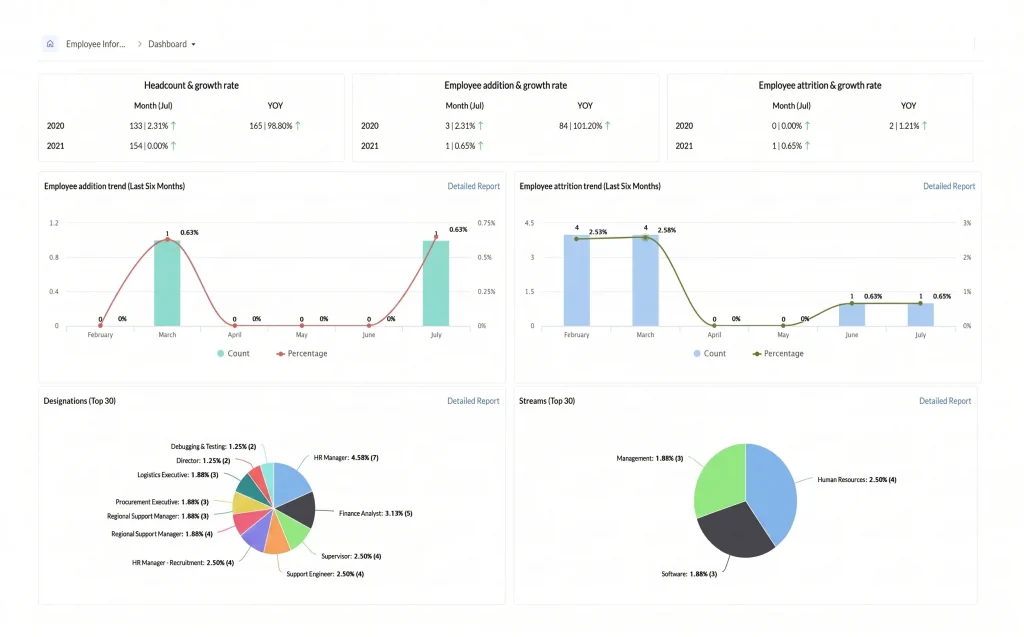
Zoho People offers core HR, leave, attendance and performance with report builders, and connects to Zoho Analytics for broader dashboarding across Zoho applications.
Ideal for: Organisations already using the Zoho suite that want HR reporting inside the same environment.
Best HR Analytics Software in India: Capability Comparison Across the Four Models
The table below covers the enterprise-scope platforms from Models 1 to 3. Mid-market platforms are deliberately excluded, since they’re designed for a different size band.
| Platform | Buying model | Best for | Key analytics strengths | Ideal company size |
| PeopleStrong | HCM-native | Indian enterprises wanting analytics tied to payroll, attendance and the full hire-to-exit stack | Cross-module reporting on one employee record; India statutory outputs from the same payroll engine; Jinie query data | 1,000–10,000+ |
| ZingHR | HCM-native | Frontline and distributed workforces | Attendance, shift and payroll reporting inside the transaction platform | 1,000–10,000 |
| Ramco HCM | HCM-native | Asset-intensive and process industries | Workforce cost and payroll variance reporting; shared master data with other Ramco applications | 1,000–10,000+ |
| Workday | Global suite module | Multinationals needing one global reporting standard | Reporting on live worker data; external data blending; scenario-based workforce planning | 5,000+ |
| SAP SuccessFactors | Global suite module | SAP-standardised enterprises | Prebuilt workforce metrics; alignment of workforce and finance reporting | 5,000+ |
| Oracle Fusion Cloud HCM | Global suite module | Oracle-aligned enterprises | Prebuilt analytics warehouse with workforce, recruitment and compensation subject areas | 5,000+ |
| Visier | Standalone analytics | Enterprises with multiple HR systems | Packaged workforce model across sources; benchmarking; guided analysis | 2,000+ |
| Crunchr | Standalone analytics | Established people analytics teams | Metric libraries, workforce planning, privacy and access controls | 2,000+ |
| Microsoft Power BI | BI layer | Microsoft-centred data estates | Full control of metric definitions; row-level security on employee data | Any, with internal BI capability |
| Tableau | BI layer | Central analytics teams | Exploratory analysis and executive visualisation | Any, with internal BI capability |
The Data Readiness Checklist to Run Before You Shortlist Any HR Analytics Software
Data problems tend to surface late, once configuration is already underway. Work through this before demos, and take the answers into every vendor conversation.
- Single employee identifier. Confirm whether one employee ID follows a person across recruitment, core HR, payroll, attendance and exit records, or whether each system issues its own.
- Agreed definitions. Write down how your organisation defines headcount, active employee, attrition and cost-to-company, and check whether payroll, HR and finance currently use the same versions.
- Contract and third-party workforce. Decide whether contractors and vendor-supplied staff appear in your workforce numbers, and confirm which system holds their records today.
- Multi-entity structure. Map your legal entities, registered establishments and cost centres, and check that every employee record carries the right entity tag.
- Historical depth. Establish how many years of clean payroll and exit history you can migrate, since attrition trends and seasonality need more than a few months of data.
- Attendance granularity. For shift-based or plant operations, verify whether attendance data reaches the platform at shift level or only as a monthly summary.
- Access rules. Define who may see salary-level data, who sees team-level aggregates only, and how that maps to role-based access in the platform.
- Refresh expectations. Agree what genuinely needs to be current daily and what can be monthly, because near-real-time refresh across every source adds cost and fragility.
- Ownership after go-live. Name the person accountable for report definitions and data quality once the implementation partner leaves.
Statutory Reporting Indian Enterprises Cannot Leave to Spreadsheets
Statutory outputs are where reporting accuracy stops being a management inconvenience and becomes a regulatory exposure. Each of these should come out of your HR and payroll platform, built to support compliance with the relevant law, rather than being assembled manually each cycle.
- Provident fund filings. Monthly electronic challan-cum-return data for the Employees’ Provident Fund Organisation, reconciled to the payroll register.
- Employees’ state insurance. Contribution data for covered employees, with correct wage-threshold treatment as salaries change mid-year.
- Tax deducted at source. Quarterly Form 24Q returns and annual Form 16 issuance, traceable to individual salary components.
- Professional tax. State-wise slabs and filing calendars, which differ across the states you operate in.
- Gratuity provisioning. Liability calculations under the Payment of Gratuity Act, needed by finance for year-end provisioning.
- Maternity benefit records. Leave entitlement and payment records under the Maternity Benefit Act.
- Prevention of sexual harassment reporting. Annual reporting obligations under the POSH Act, including committee and case records.
- Contract labour registers. Registers and returns under the Contract Labour (Regulation and Abolition) Act where you engage contractors at scale.
Where analytics and statutory data come from one payroll engine, the headcount in your board deck and the headcount in your filings reconcile by default. Where they come from different systems, someone reconciles them by hand every month. That’s exactly the work that quietly consumes an HR operations team.
The Honest Limitations of Each Analytics Model, Including Ours
No model is free of trade-offs. Knowing which one you’re accepting is more useful than hoping it won’t apply to you.
HCM-native analytics, including PeopleStrong
Analytics is scoped to what the platform holds, so external data such as sales productivity or plant output needs an integration before it can sit alongside workforce metrics. Customers have raised specific points about PeopleStrong too: occasional slower loading and session timeouts, limits on very deep customisation of workflows and report layouts, and parts of the interface that look dated next to newer tools. How to mitigate: agree your five or six board-level metrics during implementation and have them configured then, rather than assuming you’ll build them later. Confirm which external data sources need connectors on day one. Use scheduled report delivery for heavy recurring extracts instead of running them interactively at month-end.
Global suite analytics modules
Depth comes with configuration weight. Reporting structures, security models and metric definitions all need deliberate design, and most programmes run with implementation partners, which extends timelines and adds cost. How to mitigate: phase the rollout so core workforce reporting goes live before advanced planning modules, and budget for internal HRIS capability rather than treating post-go-live configuration as a vendor task.
Standalone analytics and BI layers
You’re buying analysis, not data. Someone has to build and maintain connectors, reconcile identifiers between systems, and keep definitions stable as source systems change. Statutory outputs stay with your payroll system regardless. How to mitigate: fund a named data owner from the start, freeze metric definitions in writing before the first dashboard is built, and test what happens to your reports when a source system is upgraded.
Mid-market HRMS reporting
Reporting depth is designed for the size band these products serve, so multi-entity consolidation, contract workforce views and cross-module analysis usually need manual work as headcount and structural complexity grow. How to mitigate: if reporting is where you keep hitting limits but core HR still works, evaluate whether a move to an enterprise HCM platform solves both problems at once, rather than adding a separate BI tool on top of a system you plan to replace anyway.
Matching Your Enterprise Profile to the Right HR Analytics Software
| Your profile | Likely best fit | Why |
| 1,000–10,000 employees, India-only or India-led, multiple entities and states, no dedicated data team | HCM-native analytics (PeopleStrong) | Payroll, attendance and statutory data already share one record, so reporting does not depend on a data-engineering programme |
| Manufacturing with large shopfloor and white-collar mix | HCM-native analytics with shift-level attendance (PeopleStrong, ZingHR) | Absenteeism, overtime and contract workforce analysis need attendance granularity, not monthly summaries |
| BFSI with strict access and audit requirements | HCM-native or global suite with mature role-based access | Salary-level visibility must be controlled by role, and numbers must trace back to source records |
| 10,000+ employees across many countries with a large HRIS team | Global suite analytics module | One global reporting standard justifies the configuration and programme effort |
| Several HR systems you cannot consolidate in the next two years | Standalone people analytics (Visier, Crunchr) | A common workforce model across sources buys time while consolidation is planned |
| Strong internal BI team, Microsoft or Tableau already standard | BI layer on top of your HR systems | Full control of metric definitions, provided data ownership is funded |
| Under 500 employees, single entity | Mid-market HRMS reporting (Keka, greytHR, HROne, Zoho People) | Enterprise analytics depth is not the constraint at this size |
| Outgrowing a mid-market platform, headed past 1,000 employees | HCM-native enterprise platform | Solves reporting depth and core HR scale in one move rather than layering tools |
Making the Call: Connected Analytics or a Separate Reporting Layer
The choice comes down to a handful of concrete factors. Count how many systems currently hold parts of your employee record, and be honest about whether consolidation is realistic in the next 18 months. Check whether you have a named owner for data definitions and pipeline maintenance after go-live; if that person doesn’t exist, a standalone analytics layer will struggle whatever the product’s quality. Look at whether your statutory filings and your management reporting come from the same payroll data today, since that single fact decides how much monthly reconciliation your team absorbs. Then weigh attendance granularity if you run shifts, multi-entity tagging if you operate across states, and role-based access if salary data must stay restricted. Where those factors point towards analytics that reads the same record as payroll, hiring and performance, connected HCM-native analytics is usually the shorter path. Where you genuinely cannot consolidate source systems, a dedicated workforce analytics layer earns its keep.
To see how cross-module reporting behaves on your own data, schedule a demo of PeopleStrong’s HR analytics and payroll platform using your multi-entity headcount, shift attendance and attrition scenarios.
FAQs
What is the difference between HR analytics and people analytics?
The terms are used interchangeably in most Indian enterprise buying conversations, and vendor product pages rarely distinguish them. Where a distinction is drawn, HR analytics tends to describe reporting on HR processes such as payroll cost, attendance and hiring throughput, while people analytics leans towards workforce questions like attrition drivers, internal mobility and workforce planning. When comparing platforms, ignore the label and check which employee data the tool can actually reach.
How long does it take to implement HR analytics software in an Indian enterprise?
It depends far more on data condition than on the product. Where analytics sits inside an HCM platform you’re already implementing, reporting typically goes live with the core modules. Where you’re layering analytics over several existing systems, the connector build, identifier mapping and definition alignment usually take longer than the dashboard configuration itself, which is why the data readiness checklist above matters before you commit to a timeline.
Can HR analytics software predict attrition reliably?
Attrition models can identify populations with elevated risk, such as particular grades, locations or tenure bands, and that’s genuinely useful for targeted retention action. They’re far less reliable at predicting individual resignations, and shouldn’t be presented to managers as though they were. Prediction quality also depends on having several years of clean exit and payroll history, which many organisations discover they don’t have until migration begins.
Do we need a data warehouse before buying people analytics software in India?
Not if your HR, payroll and attendance data already sits in one HCM platform, since the analytics layer reads the same record. A warehouse becomes relevant when you run multiple HR systems, or when you want to combine workforce data with production, sales or finance data for joint analysis. In that case, budget for the pipeline and a named data owner, not only the analytics licence.
How much does enterprise HR analytics software cost in India?
Pricing at this tier is quote-based and varies with employee count, modules, entities and implementation scope, so published list prices are rare. The costs buyers most often underestimate aren’t licences. They’re integration build, historical data migration and the internal time spent agreeing metric definitions. Ask every vendor to quote implementation and first-year support separately from subscription so the models can be compared on the same basis.